Progress Flowmon is a core network monitoring and security tool. Confirming if it is up and running can mean the difference between responding to a data breach or overlooking such a critical event. Like any other critical system, it is a good practice to include the monitoring of Flowmon uptime, resource consumption and health in an IT infrastructure monitoring (ITIM) dashboard, such as Progress WhatsUp Gold.
Like many other ITIM tools, WhatsUp Gold provides various remote monitoring capabilities, such as SNMP, SSH or REST API-based "active" (WhatsUp Gold initiated) monitors or "passive" (Flowmon-initiated) Syslog monitoring.
Depending on your environment size, either the WhatsUp Gold Free edition (for smaller deployments) or a commercially licensed version (for larger environments) would suffice.
Generic SNMP Monitoring
If the SNMP server is active on the Flowmon appliance and proper credentials are set in the WhatsUp Gold discovery, there are a lot of useful SNMP monitors applicable for Flowmon monitoring:
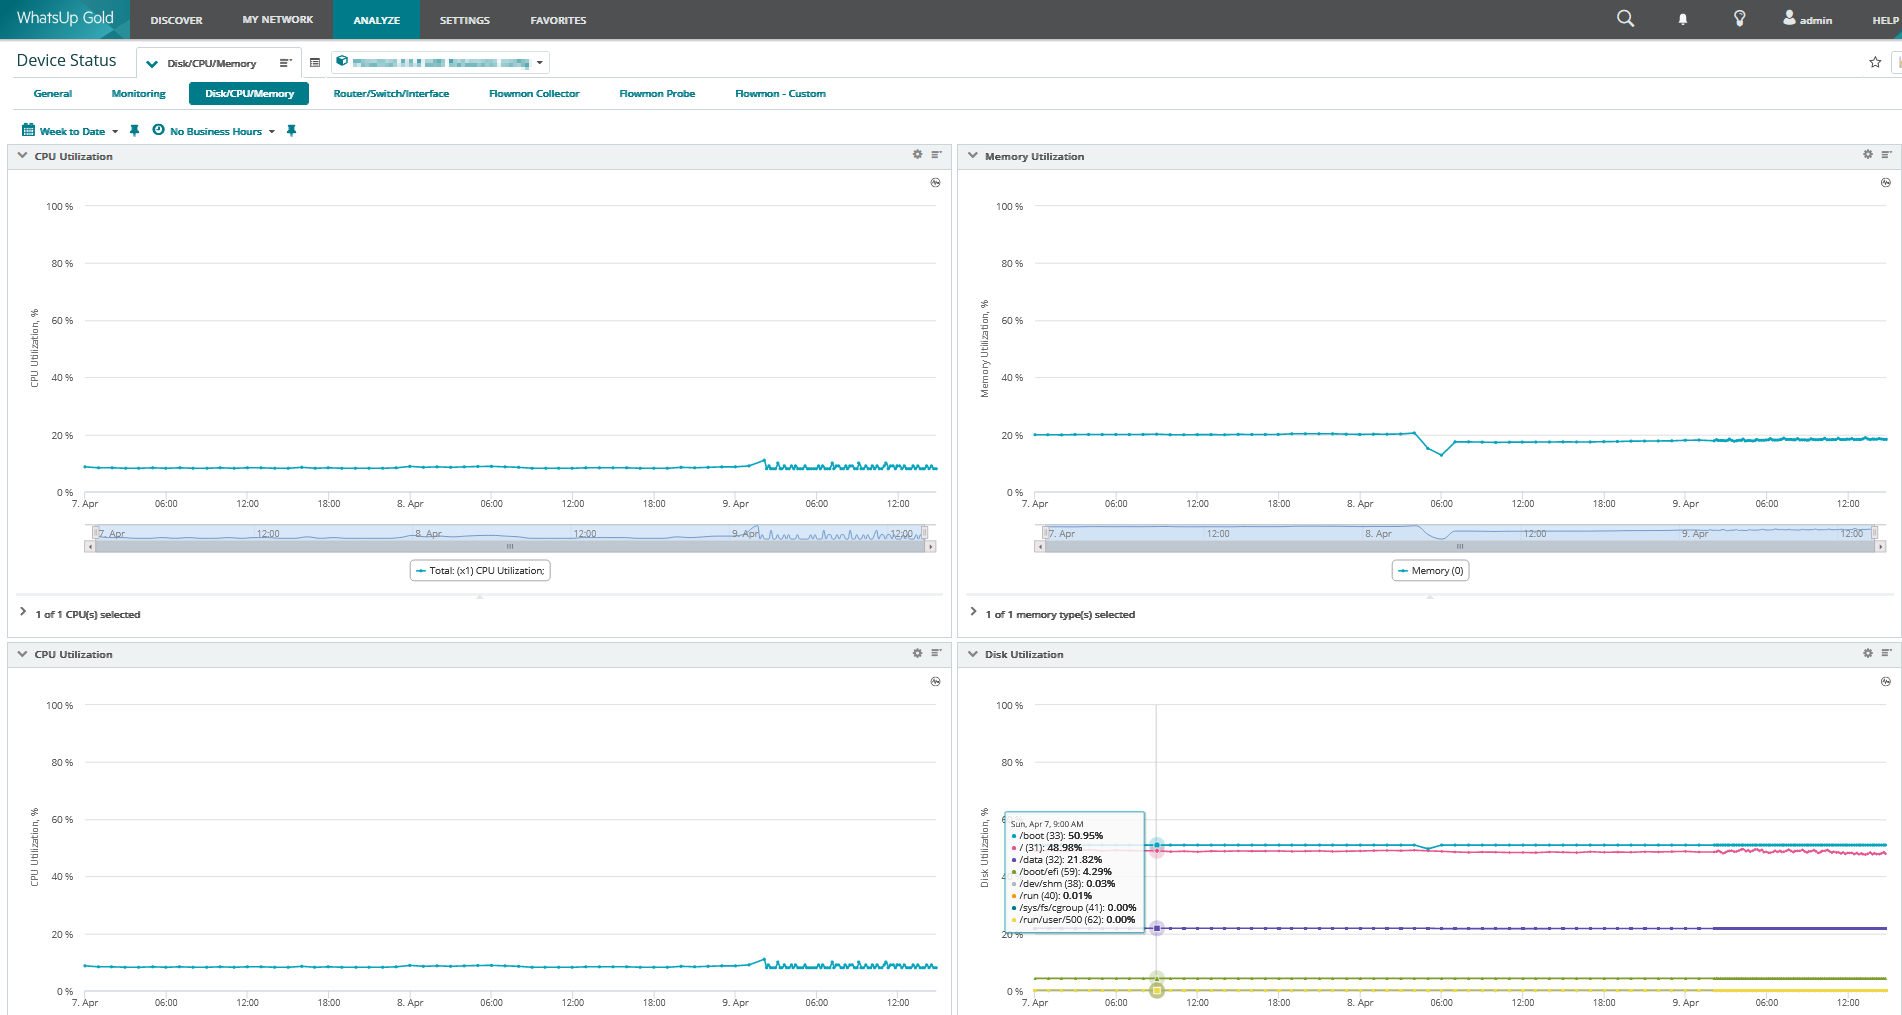
- CPU utilization (total and/or by CPU core) - It should be stable in the long term. In the short term, it may be affected by the trend of incoming traffic or running analysis queries. If it is too high, some long-running and expensive queries may affect your appliance performance.
- Memory utilization - Again, it should be stable from a long-term perspective.
- Disk utilization (by disk partition) - It is important to watch long-term trends (for capacity planning) and short-term unexpected growth (this may indicate logging or data collecting issues). If there is an issue, check the Resources Manager settings in Flowmon for more details about the disk space structure utilized.
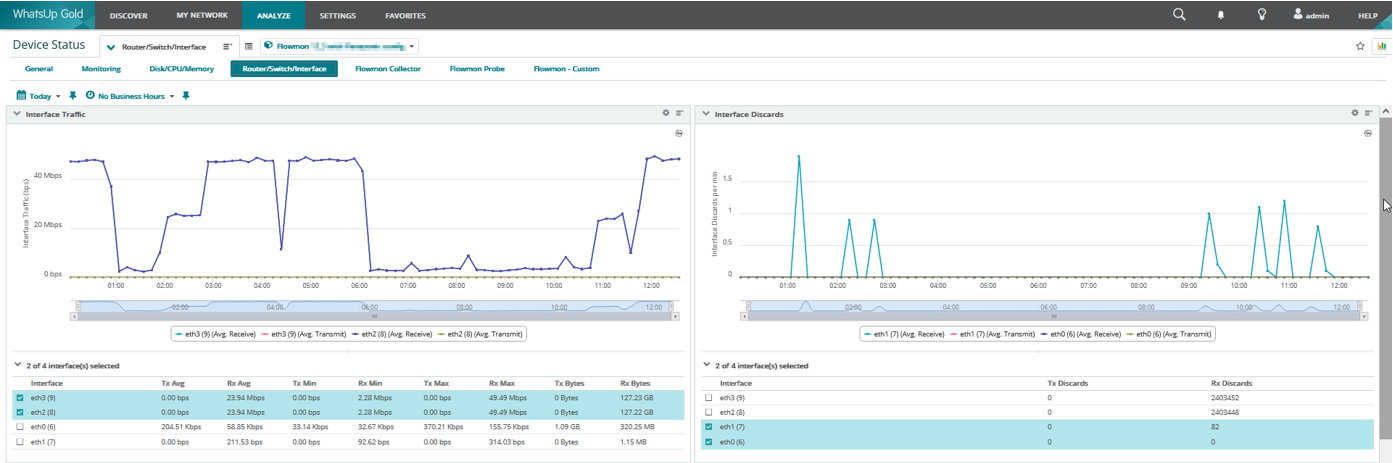
- Network interface utilization - Network interface utilization provides an overview of incoming and outgoing traffic. Suppose the amount of incoming bps is significantly higher than the traffic internally processed by the probe (see below). In that case, it may indicate an issue with unexpected traffic using your Flowmon appliance network connection.
Flowmon SSH Monitoring
If we want to dive deeper, there is a lot of other useful information and performance metrics that may be helpful to collect to get an overall overview of the Flowmon appliance health. However, some of them are not available using SNMP. There are other ways to access monitored devices in WhatsUp Gold, for example, REST API or SSH.
SSH scripting naturally provides all the necessary flexibility. However, it is always important to consider the monitoring's performance. Monitoring should not be invasive, so it should not affect the monitored machine’s configuration, functionality or performance.
A couple of important metrics to watch are as follows:
Flowmon Collector
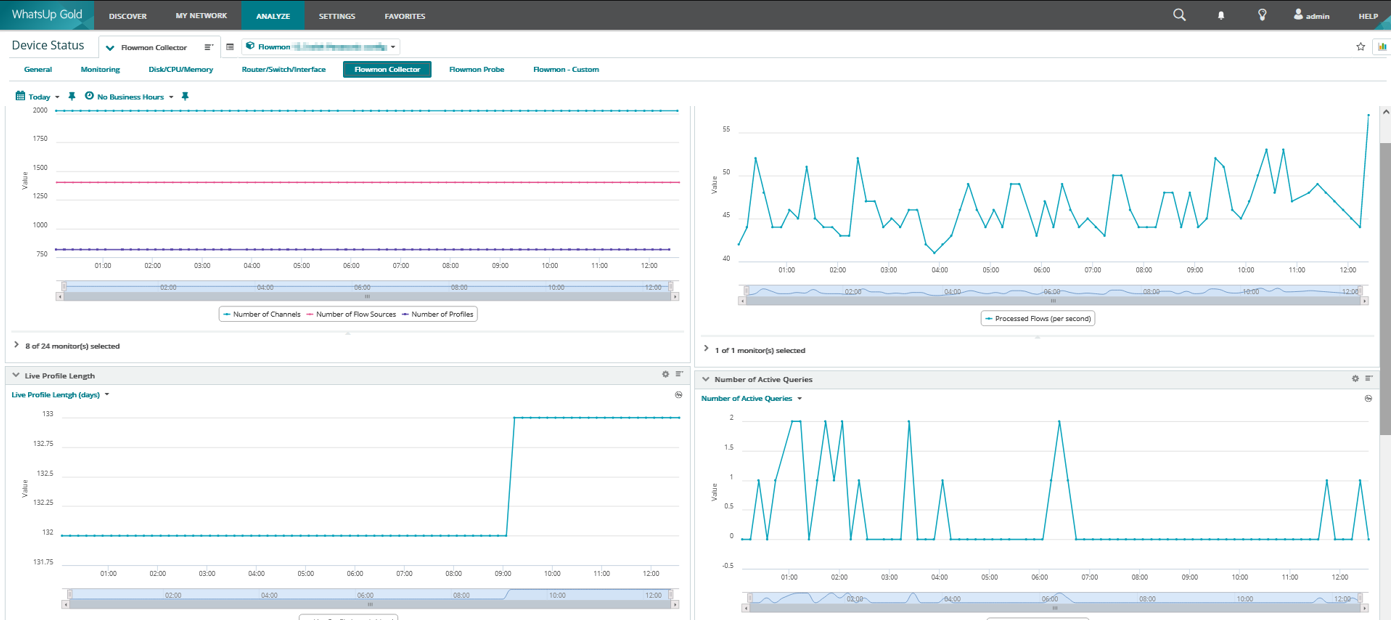
- Flows per second
The number of network flows processed per second. This is the most important metric to see. If there is an unexpected drop, flows are either lost before they reach Flowmon Collector or degradation is caused by performance issues on Flowmon Collector itself.
- Number of Flow sources
This number should only increase if a new flow source is detected on the device – for example, adding a new probe or router to the infrastructure with enabled flow-export to the device. The number only decreases if a flow source is removed by a user on the device.
- Number of Profiles & Channels
The number of profiles and channels directly reflects the configuration. It will be a steady number if there is no configuration change. A significant increase in the numbers is a result of bigger changes in the configuration – for example, the import of several configuration presets.
There is also a correlation between the number of profiles, channels and CPU/Memory utilization. If the number of profiles or channels increases, then the CPU/Memory utilization is expected to grow.
- Live Profile Length (days)
The number of days of historical data that can be stored in the All Sources profile. This depends on disk quota settings and the amount of incoming flow data.
- Number of active queries
The number of actively running nfdump queries at the moment of the poll (triggered from the Flowmon Analysis page, for example). Too many concurrent activities may negatively impact your Flowmon Collector performance.
- Total duration of active queries
The total duration of all actively running nfdump queries. High values may be caused by long-running queries which can potentially negatively impact your Flowmon Collector performance.
Flowmon Probe
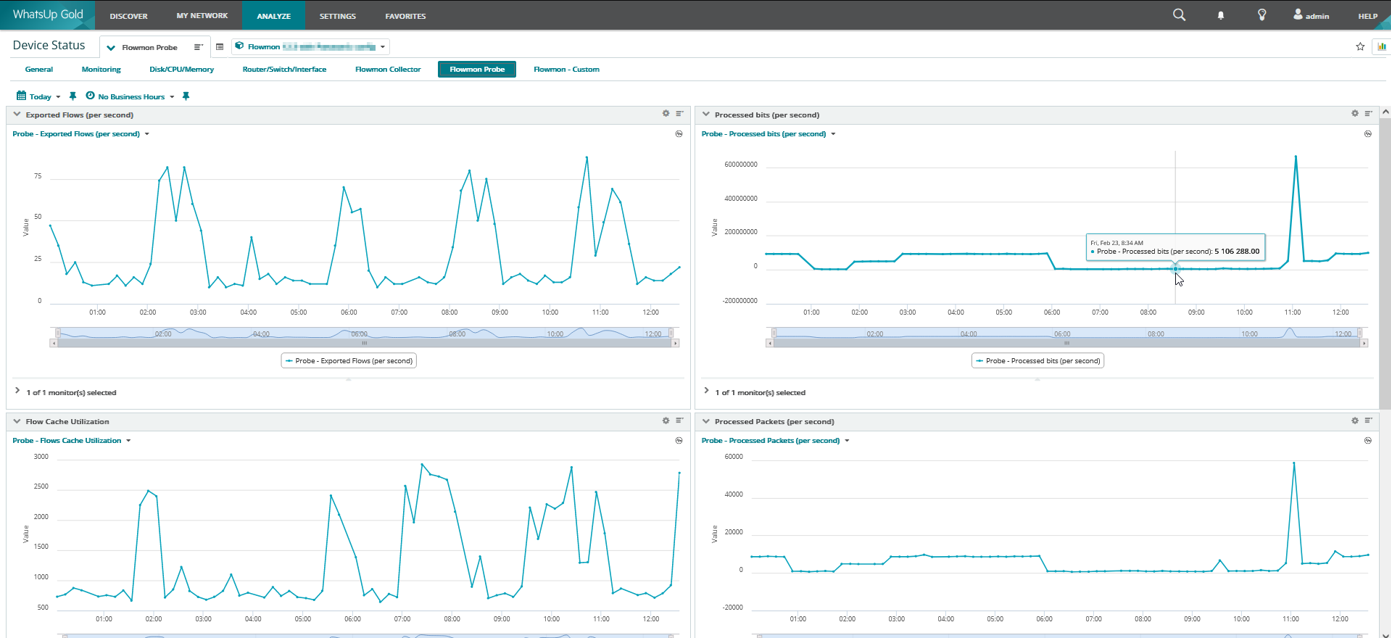
- Processed bits per second
Average number of bits processed by the Probe per second. The value of this metric should mirror the amount of traffic captured by monitoring interfaces.
- Processed Packets per second
Average number of packets processed by the Probe per second.
- Flows Cache Utilization
The number of flows in the flow cache. If the number is growing, it means there are more unique flows than usual coming into Flowmon Collector – this can be caused by a Distributed Denial of Service (DDoS) attack.
- Flows Merged per second
Average number of flows generated from IPv4 fragmented traffic per second. High values may indicate a lot of fragmented IPv4 traffic.
- Exported Flows per second
Average number of flows exported by the Probe per second.
- Flow Cache Collisions per second
The average number of collisions in the flow cache per second should be 0. If it is too high, it may indicate a performance problem, and the cache may need to be adjusted.
Import of Custom SSH Monitors Configuration to WhatsUp Gold
You can easily import the monitors described above using the Import Role feature:
- Login to the WhatsUp Gold web console.
- Navigate to Settings > Libraries > Roles and Sub Roles Library.
- Click Import and select the wug-role-flowmon.json configuration file.
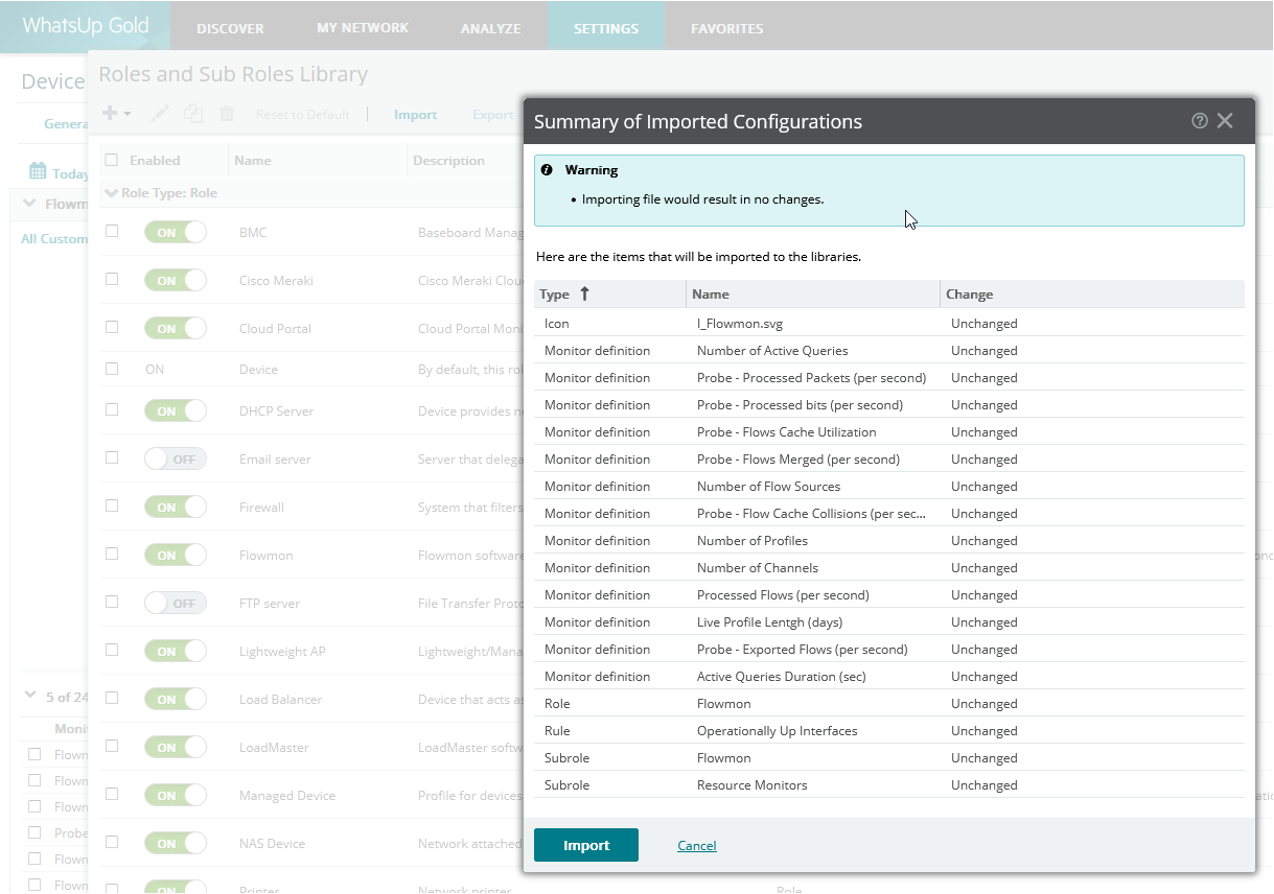
- Review the Summary of Imported Configurations and Import.
- Navigate to Discovery and create new Scan.
- Insert your Flowmon appliance IP address, and valid SNMP and SSH credentials and run the scan. Discovery finds your Flowmon appliance and offers all applicable monitors.
- Import discovery results and monitored values will appear in a few minutes.
Other Related Resources: