OT technology is deeply connected to the physical environment where tremendous damage can happen. Just imagine a country-wide blackout, the disruption of energy production, oil or gas delivery, or just such a simple thing such as traffic lights in a busy city under the control of an attacker. None of those scenarios is impossible and we have already faced such situations in reality.
The majority of OT attacks start in traditional IT
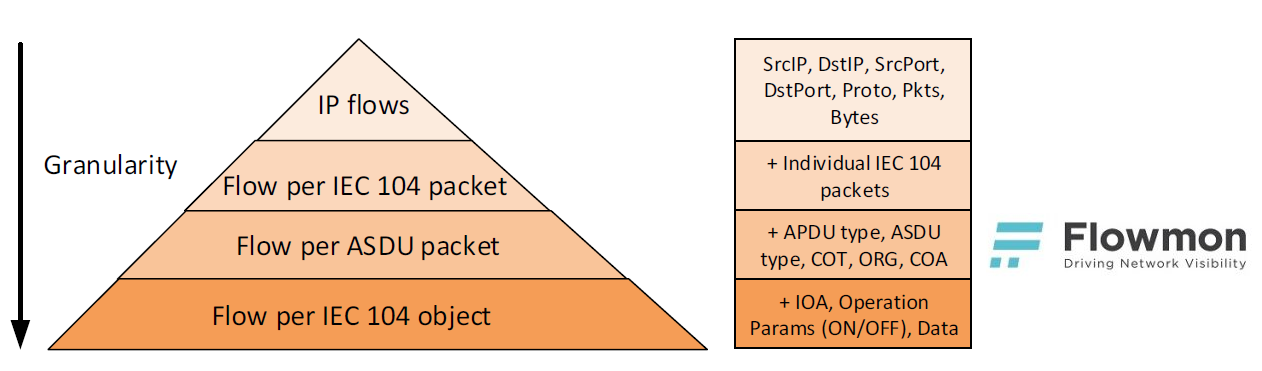
The OT environment is very fragile and placing invasive monitoring or security tools such as intrusion prevention systems or antiviruses is close to impossible. Therefore, security measures are usually limited to firewalls being deployed on the perimeter of the OT environment leaving all the internal traffic as a blind spot. Addressing this issue is straightforward. You can always place security technology on the SPAN (mirror) port and use it in non-invasive way, which means monitoring and detection. This is the reason Flowmon Probes are being more and more deployed in the OT environment, providing a consolidated view of the whole infrastructure and enabling anomaly detection throughout the whole organization. The main advantage over specialised SCADA security tools is their general applicability and ability to recognise an attack before it hits the OT environment. The majority of OT attacks start in traditional IT, reveal themselves in indicators of compromise detectable by a network behaviour analysis approach. Complex monitoring is crucial for early detection and remediation before the attack hits the OT environment.From the analysis of the “BlackEnergy” attack that hit the Ukraine power grid operated by NES@FIT (Network and Distributed Systems Research Group) it is clear that the stages such as a phishing campaign, exploitation, VPN credential theft and network discovery happened before the main attack could reach the OT environment. All of these stages are observable from the perspective of network monitoring and network behaviour analysis. More detail regarding the general scheme of ICS Cyber Kill Chain are explained in a SANS Institute report.To gain real benefits of network monitoring and anomaly detection in the OT environment, visibility into the main OT protocol is needed. This is usually beyond the scope of common flow monitoring tools and flow data provided by routers or switches. Let us take the IEC 104 protocol used in energy distribution grid control as an example. Extended flow data can provide a valuable insight into application protocols, including OT specifics. Full application level visibility is technically possible due to no encryption.Traditional flow data used to provide an aggregated view of traffic in the OT environment is insufficient to understand traffic patterns, commands or even to recognise malicious activity. Per packet reporting at a header level enables a way to recognise patterns in packet sequences, unfortunately with no way to analyse and interpret the data. Adding application level metadata brings a balance between the level of detail and available information for subsequent analysis. The last option is full packet data; this brings many challenges for performance, data retention, processing and analysis in general. These approaches are presented in figure 1.
Figure 1: Level of detail available by different tools in the OT environment (shown using the IEC 104 protocol).
Simulated OT attack in detail
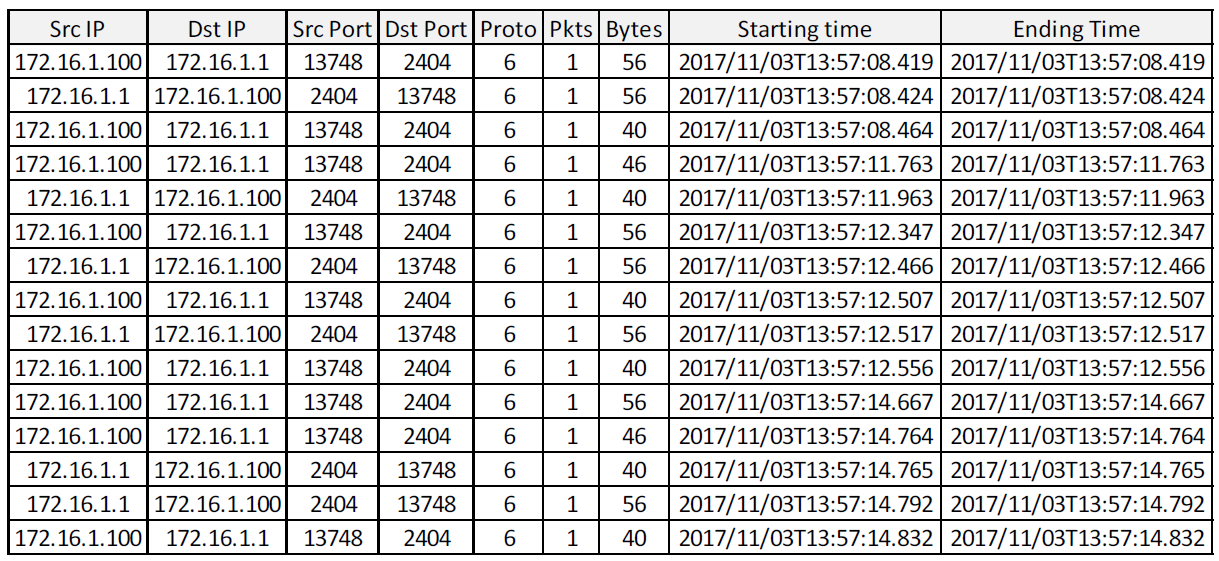
Let us show the importance of the level of detail in the following example. Consider an OT attack “switch breaker activation” that is trying to damage a device by continuously sending the TURN ON and TURN OFF command. We have simulated such an attack in a lab environment and monitored the network traffic with different technologies. First, we used traditional NetFlow v9 that provided us with flow records representing communication between the controller (172.16.1.100) and the device (172.16.1.1). Traditional NetFlow provides an aggregated view of traffic between the controller and device. Using flow data, we can recognise volumetric anomalies in data exchange between the nodes, and reveal new, currently unknown communication. However, our interpretation capability is limited.
Figure 2: NetFlow v9 records corresponding to the simulation of “switch breaker activation”.

Using SilkTools we have generated a single flow per packet. Besides traditional flow data this enables us to recognise traffic patterns in terms of packet size distribution over time. Again, our interpretation capability prevents us from gaining a real insight.
Figure 3: Flow records generated per packet using SilkTools.
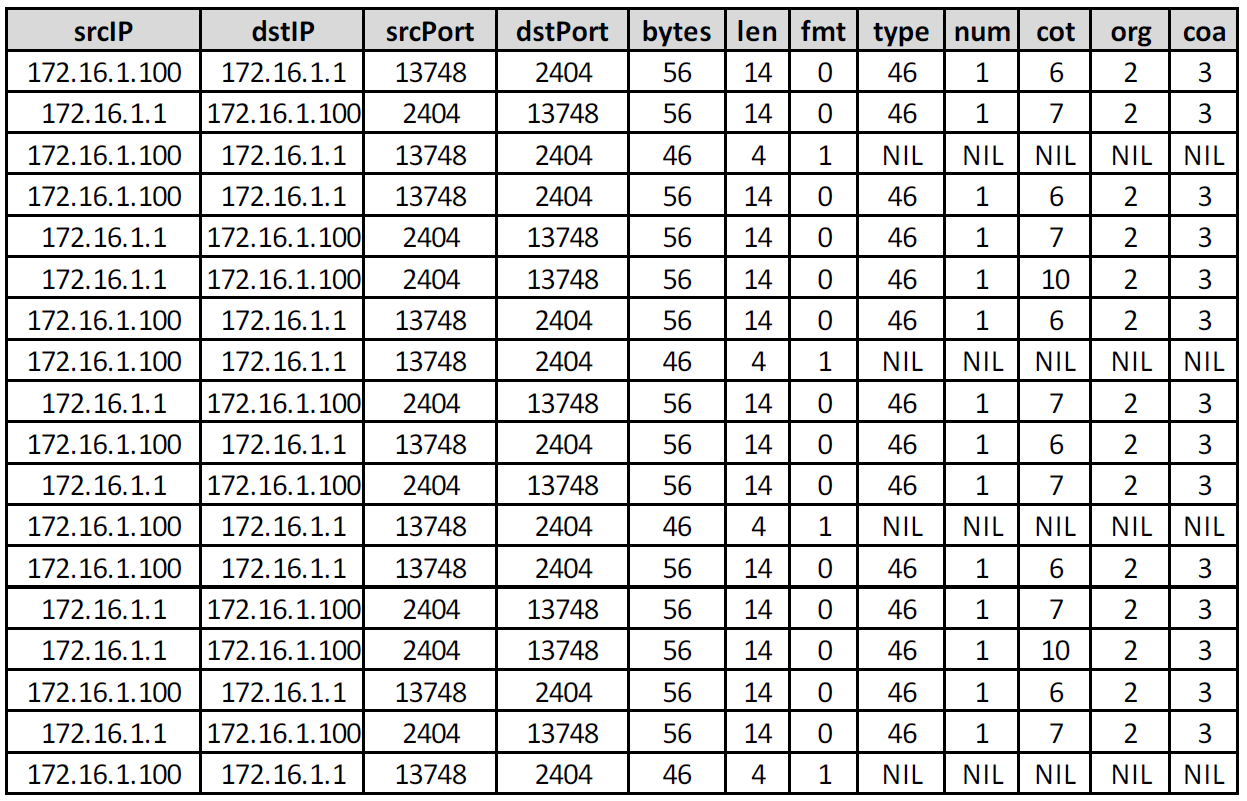
Visibility into the IEC 104 and full packet trace
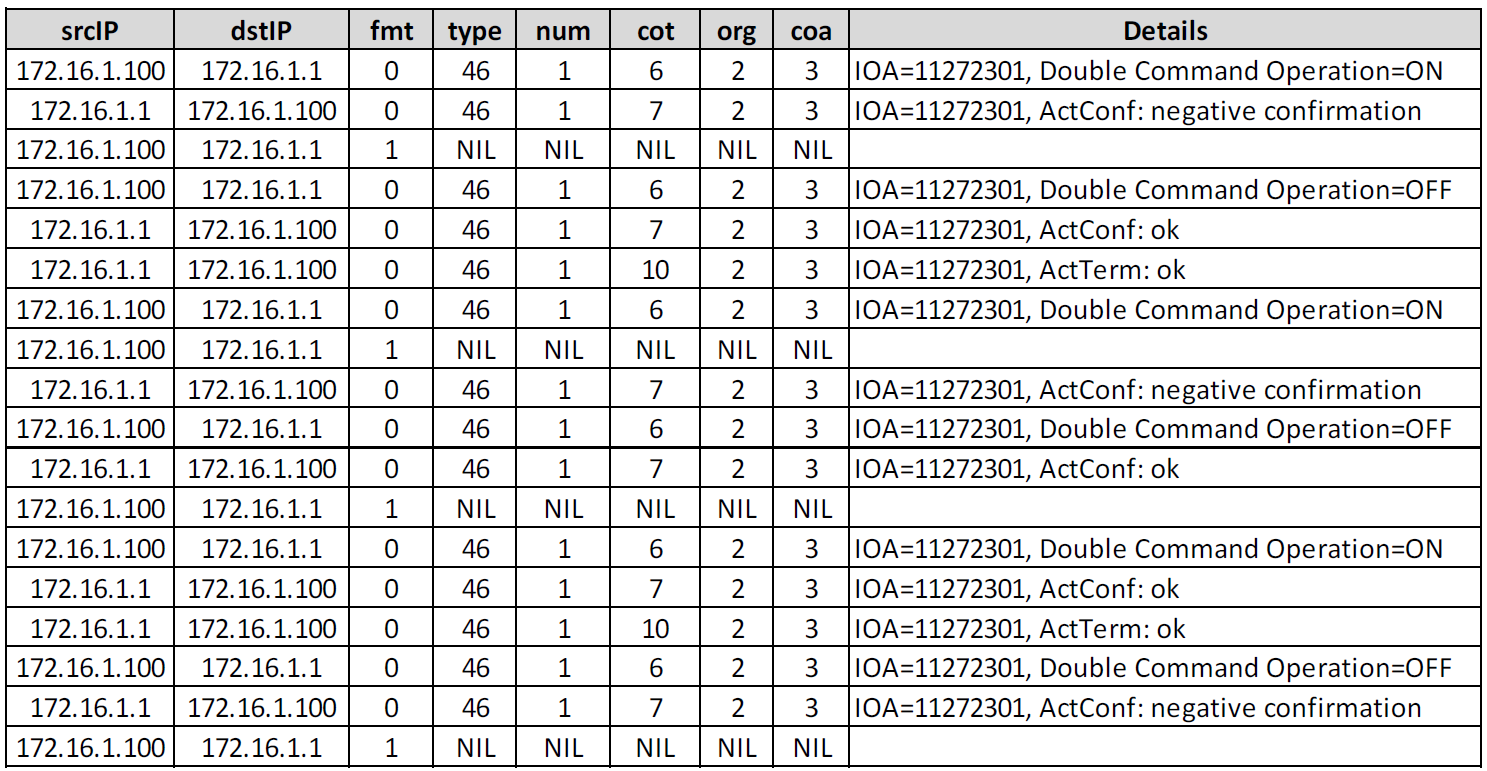
Finally, we have generated enriched flow data using Flowmon Probe, providing visibility into the IEC 104 protocol at a metadata level. Besides L3/L4 visibility we can extract major metadata from the application level to interpret any activity at an operational or command level. Flow IEC 104 following information is available (the only explanation needed to understand figure 4 is included):● fmt - APDU frame type format (0 = data, 1 = supervisory)● type - ASDU type (46 = double command)● num - number of elements● cot - cause of transmission (6 = Activation, 7 = ActivationConfirmation, 10 = ActivationTermination)● org - originator address● coa - common object address (ASDU address)Figure 4 shows flow data extended with application level information from the IEC 104 protocol revealing a repetitive sequence of a continuous activation command being pushed to a device from the controller.
Figure 4: Extended flow data in IPFIX format with IEC 104 protocol extensions.
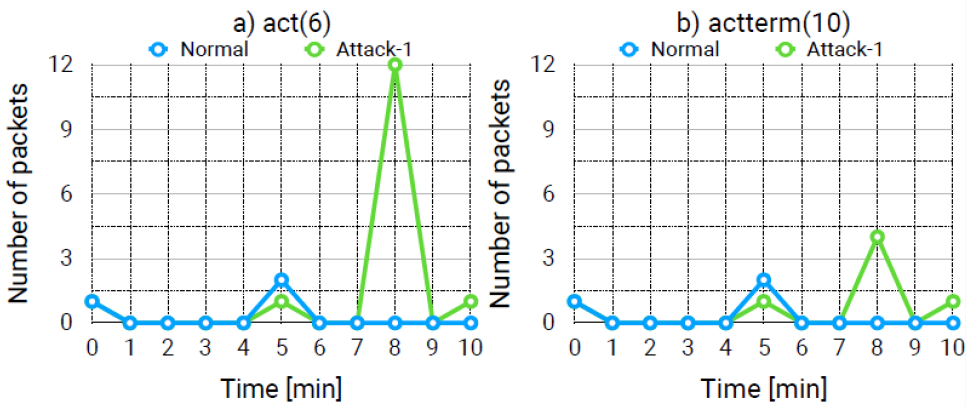
Observing time distribution in figure 5 of ActivationConfirmation and ActivationTermination operations in the network traffic enables us to recognise an anomaly and trigger, e.g. packet capture for forensic analysis or more detailed visibility related to the detected anomaly.
Figure 5: Time distribution of ActivationConfirmation and ActivationTermination operations in normal and attack traffic.
Full packet trace confirms the activity in detail. The controller is continuously turning the device on and off at such a rate that the device cannot follow up the commands and perform operations as fast. This is the reason for the “negative confirmation” received. The full data log is shown in figure 6.
Figure 6: Packet level detail added to flow data showing real values transmitted between the controller and the device.
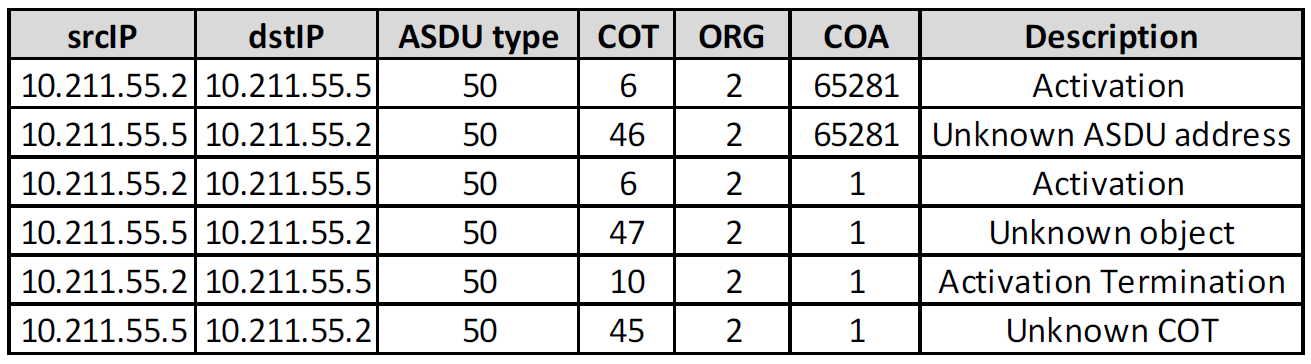
Another example of malicious activity in an IT environment is port scanning. The attacker is mapping the attack surface to identify systems and services for a subsequent attack. A side effect of port scanning is revealed in the many unsuccessful connections that are easy to detect using flow analysis. In the OT environment service enumeration occurs at a different level. The attacker is looking for various objects available on the devices and this activity is hidden in a single flow. Application level visibility enables a way to detect such activity by receiving messages such as “unknown object” or “unknown address”, as figure 7 shows.
Figure 7: Object scanning in the IEC 104 protocol.
Flowmon to extend visibility and security in OT environment
Flowmon Probes and Flowmon Collector provide visibility into OT protocols such as IEC 104, IEC 61850 Goose and IEC 61850 MMS, DLMS, and the IoT protocol CoAP. We are continuously working on extending the scope of the supported protocol and new anomaly detection techniques to improve visibility and security in the OT environment similarly as we have done in IT for many years.
This article has been created in cooperation with NES@FIT with Petr Matousek and Ondrej Rysavy. The results presented here are part of the IRONSTONE project.