IPFIX and NetFlow Monitoring
NetFlow provides high level of network visibility while being storage efficient compare to other technologies. Flowmon collects NetFlow/IPFIX from its dedicated proprietary network probes or flow-enabled infrastructure components (routers, switches, load balancers), processes it to gain deep insight for troubleshooting, UX monitoring, security etc., and stores it for further analysis and reporting. The solution is available in physical, virtual, cloud, and hybrid environment.
Launch demo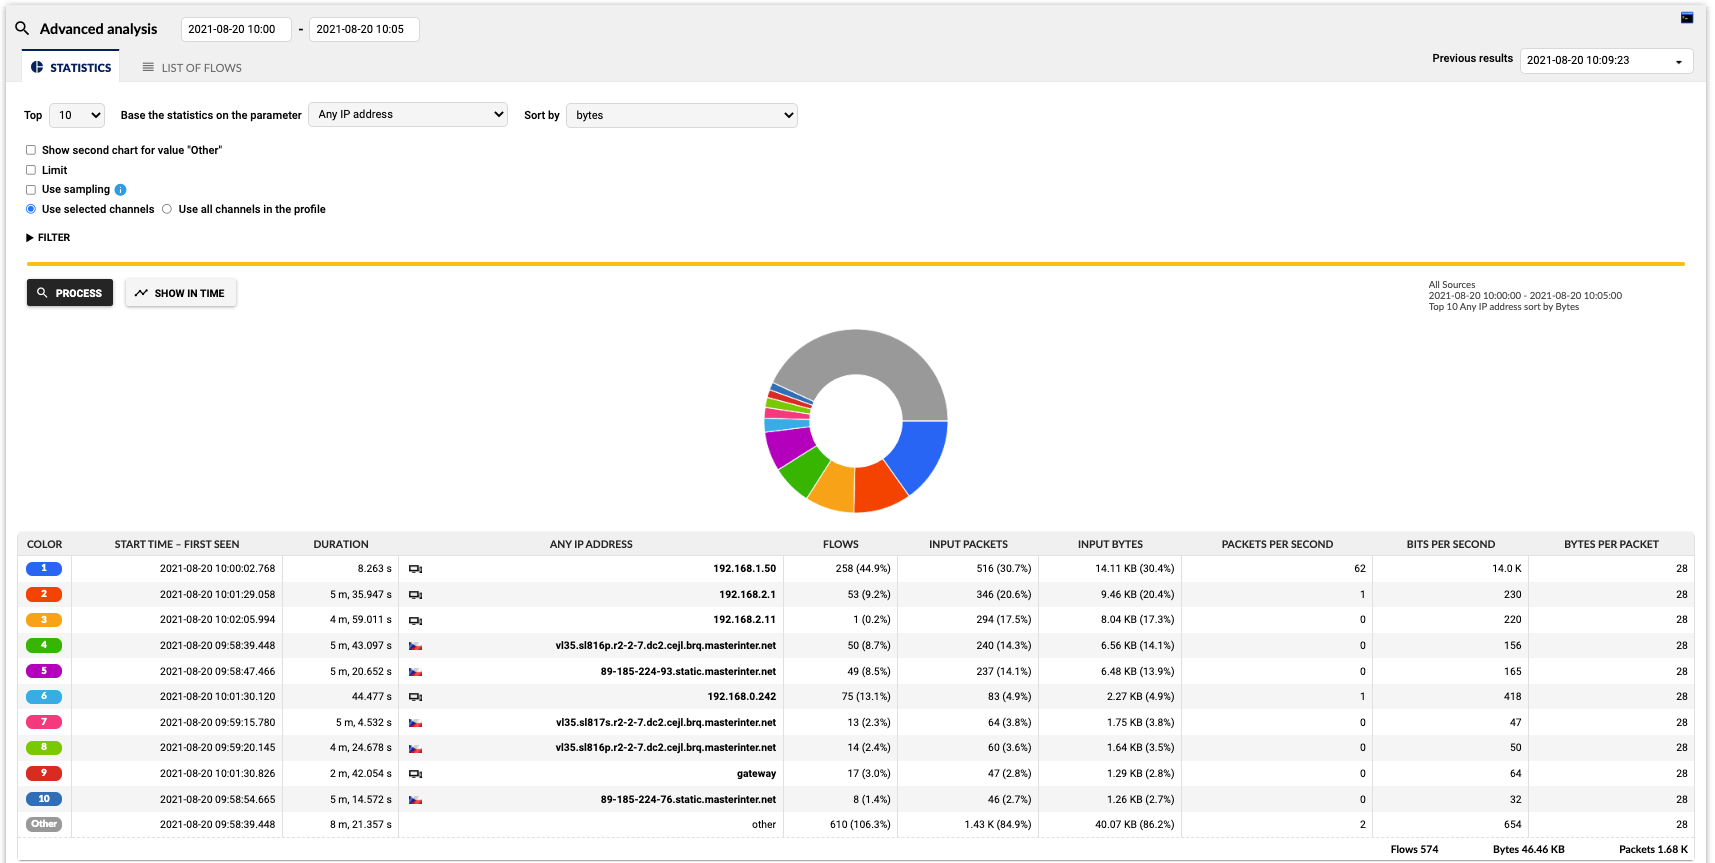
What is NetFlow?
NetFlow is a network standard originally developed by Cisco for collecting IP traffic information and monitoring of network telemetry data. NetFlow enabled switches or routers, so-called exporters, generate these aggregated traffic statistics that provide a picture of bandwidth utilisation, communication partners and clients activity.
The most commonly used format is NetFlow v5. To support a demand to extract wider data set, independent IPFIX format has emerged among a variety of proprietary formats such as jFlow, sFlow or NetStream.

What is NetFlow used for?
Network traffic monitoring generates statistics both on the underlying data transfers when abstracting from packets, and the subject of the communication itself (the content of the communication is not stored). These statistics represent the flow data in the network, which can be thought of as similar to a list of telephone calls. Network and Security Operations gain an understanding of who communicates with whom, when, how long and how often. In the language of a data network environment, they monitor IP addresses, data volumes, time, ports, protocols and this can further be enriched with latency measurements and application layer data for a variety of protocols.
What NetFlow / IPFIX is used for
- Introduce deep visibility into virtual, hybrid and cloud environments
- Detect anomalies such as unresponsive services, ransomware attacks, IP spoofing or port scanning
- Assess encrypted traffic to simplify the enforcement of security policies
- Identify top bandwidth consumers to save budget on infrastructure
- Monitor latency of SaaS applications such as Office 365, Salesforce or Google Apps
- Track user experience, identify bottlenecks and latency issues of applications
- Report on service degradation that may impact mission-critical operations
- Use advanced reporting to stay ahead of network incidents
- Observe device activity and enforce security policies, including BYOD
- Understand network incident the root-cause and affected services
- Make the most effective decisions on infrastructure and server capacity needs
- Track historical data to learn about trends and make proactive decisions
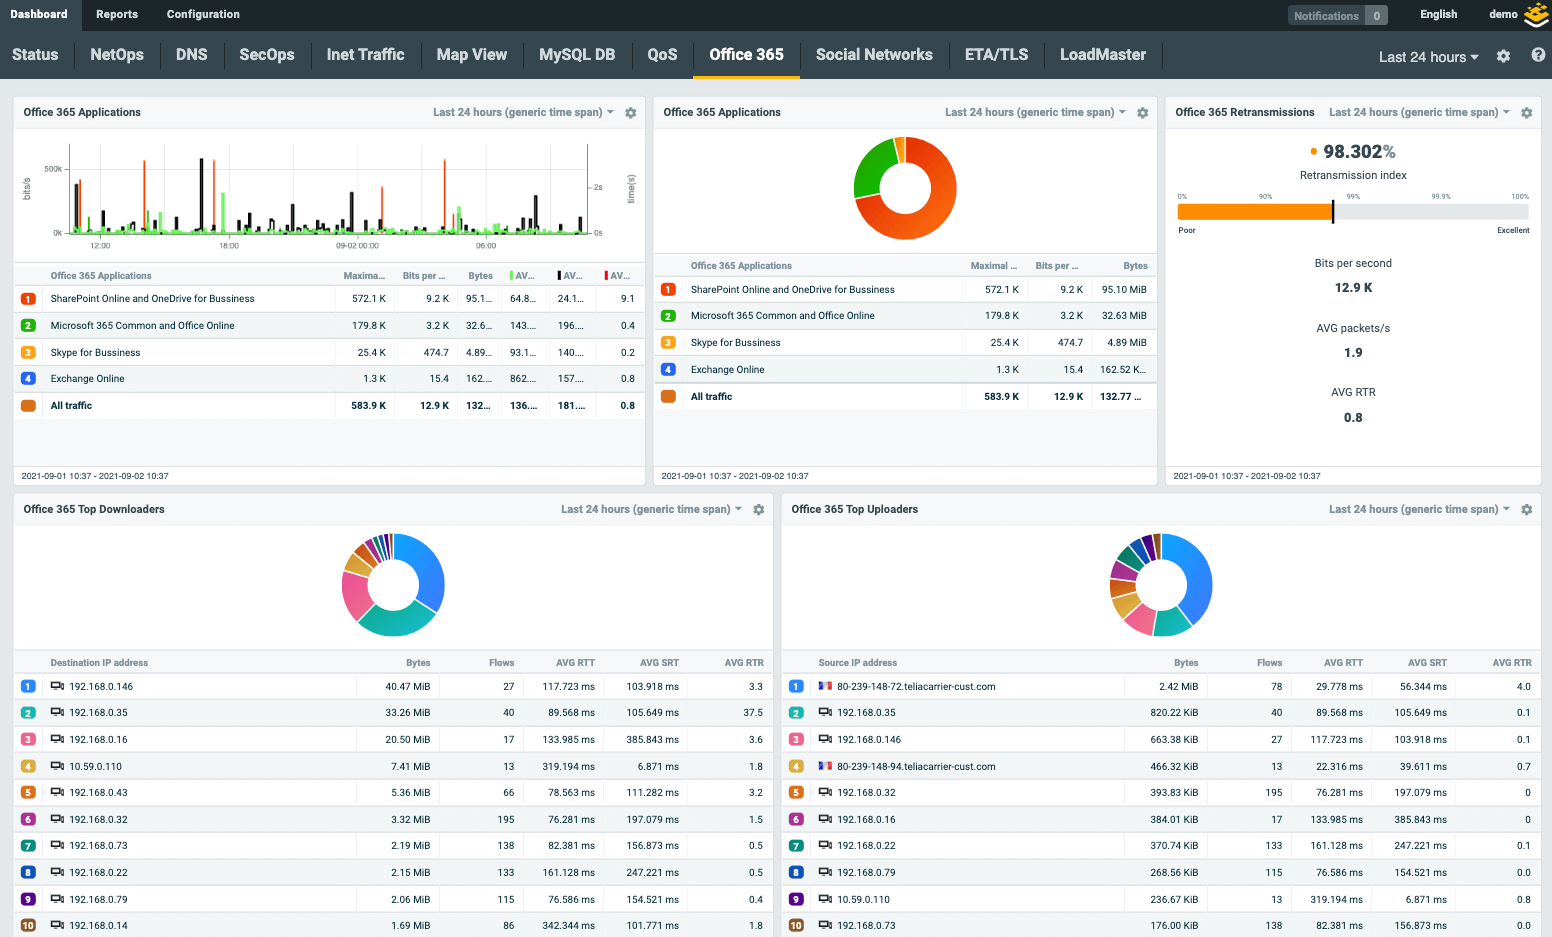
NetFlow monitoring stats visualized in dashboard
Collecting NetFlow. How does NetFlow work?
When a request from a client to the server is sent (green envelope), the active device with NetFlow export capability looks into the packet header and creates a flow record. The flow record contains information about the source & destination IP addresses and ports, protocol number, number of bytes and packets and all other information from layer 3 and 4. Individual data network communications are identified by source & destination IP addresses, ports and protocol number.
NetFlow statistics are provided by network elements (routers, switches) or by specialised standalone hardware probes. The probes are transparently connected to the monitored network as passive appliances, creating a precise and detailed flow of statistics from the copy of network traffic. This approach is used to overcome various performance and feature limitations of router-based NetFlow monitoring.
It is always important to check the router/switch documentation to ensure it supports NetFlow and if so which version. It is usually necessary to test if it does – older nodes can sometimes suffer from performance issues, do not provide precise statistics or have limited scope for monitored network traffic characteristics. NetFlow data extracted from routers or switches is an abstraction of the network traffic itself. Flow statistics are created as an aggregation of the network traffic that contains basic L3/L4 telemetry data from IP header such as IP, port or protocol or Type of Service. The content of the communication is not stored, therefore the achievable aggregation rate is about 500:1 as compared to storing full packet traces. This means that the bandwidth NetFlow exports consume about 0.2%.

How to transform your network operations with flow data
Learn more about the technical background of Netflow IPFIX technology, which enables you to resolve 95% of all troubleshooting cases.
Get the paperWhat is IPFIX?
Leveraging flexible format IPFIX, specialized exporters are able to enrich NetFlow data fields with application layer information from packet payload to provide a deeper understanding of network traffic while maintaining aggregation rate of 250:1 or 0.4% to 0.5% of the bandwidth. This brings appropriate detail while retaining scalability, providing an insight into data communication, flexible reporting and effective troubleshooting of operational issues and the detection of security incidents. This approach enables to handle up to 95% of network incidents.
What is IPFIX used for?
Such data enables to analyse traffic structure, identify end-stations transferring large amounts of data or to troubleshoot network issues and wrong configurations. In other words, it represents a sufficient level of detail to handle about 80% of network incidents, as Gartner has reported since 2012. However the level of detail contained in NetFlow data might not suffice for further troubleshooting, forensics or performance monitoring.
Data gained from IPFIX. In addition to the NetFlow stats, application data (Host Name, Average Round Trip Time and Average Server Response Time) are visible in column 9, 10 and 11.

Flowmon’s proprietary IPFIX visibility
| L2 | L3/4 | L7 | L7 (continuation) |
|---|---|---|---|
| MAC | Standard Items | NBAR2 | SMB/CIFS |
| VLAN | NPM Metrics (RTT, SRT, …) | HTTP | VoIP (SIP) |
| MPLS | TTL, SYN size, … | SNI | |
| GRE tunnel | ASN (BGP) | DNS | SQL |
| OTV | Geolocation | DHCP | SSL/TLS |
SNMP vs NetFlow and IPFIX monitoring
SNMP (Simple Network Management Protocol) is conventional and simple method for IT infrastructure resources, originally designed to network management. It collects data from network devices, giving information on their availability and status (CPU and RAM utilization, how much bandwidth network device consume etc.). An agent running on a managed device reports the requested information via SNMP to the manager.
Flow data technology, mostly represented by NetFlow and IPFIX, is a passive, agentless technology dedicated for network monitoring with several operational and security applications. It provides comprehensive information on who communicates with whom, when, how long and how often (IP addresses, data volumes, time, ports, protocols and other technical characteristics of TCP/IP communication in the third and fourth network layer). Network traffic monitoring with NetFlow generates statistics both on the underlying data transfers and the subject of the communication itself (the content of the communication is not stored).
To better describe the difference, let’s imagine a situation where an unexpected traffic anomaly occurs and network traffic increases significantly – SNMP gives the administrator information about the increased number of packets and volume of the transferred data on network interfaces. But what else? What is the origin of this anomaly? Which device is responsible for the traffic increase? What protocols and services are involved in this situation? These are the questions that traditional SNMP infrastructure monitoring is not able to answer. It doesn’t look into the network traffic itself, and therefore has no information about its structure. This is the situation when NetFlow comes into a play.
List of Flow standards
NetFlow comes in many standards and proprietary forms, each varying in functionality and usability.
| NetFlow v5 | Original Cisco standard for flow monitoring supported by many routers and switches. Fixed format and set of attributes focusing on L3/L4 network information. Considered as obsolete now due to many limitations like missing IPv6 traffic information or no extensibility. Supported by many monitoring tools and applications. |
|---|---|
| NetFlow v9 | Extended flow monitoring standard dealing with limitations of version 5. Provides IPv6 traffic monitoring, information from L2 like MAC addresses or VLAN tags. Details are covered in RFC 3954. |
| Flexible NetFlow | A Cisco standard, similar to NetFlow version 9 with more flexibility on flow export configuration and customization on key fields (how packets are being aggregated to flows) and what information is being exported. Flexible NetFlow extends monitoring to L7 by technology NBAR2 (Network Based Application Recognition) which identifies application based on payload. |
| IPFIX (NetFlow v10) | Independent international standard that enables vendors of flow-based monitoring tools like Flowmon Probe to define own protocol extensions to export literary any information from L2 to L7. Flowmon is a pioneer of this technology providing visibility into many application protocols since 2012 with continuous grow of supported protocol scope. This is crucial technology that enables to deliver unique network visibility without the need for continuous packet capture, integrate NetOps & SecOps into single platform and scale in a multi 100G environment. Specifications for IPFIX are covered by RFC 7011 through RFC 7015, and RFC 5103. In the Cisco environment, IPFIX is usually referred to as NetFlow v10. Standardized by IETF. |
| jFlow | Juniper standard for flow monitoring available in both version v5 and v9. The main difference compared to NetFlow is that timestamps of exported flow data are preserved for the whole network session which needs a bit different handling on collector side. In general, this standard is compatible with NetFlow. |
| NetStream | Huawei standard for flow monitoring available in both version 5 and 9. This standard is compatible with NetFlow. |
| cflow | Alcatel-Lucent standard for flow monitoring available in both version 5 and 9. This standard is compatible with NetFlow however usually available only as sampled flow data. |
| NEL / NSEL | NEL stands for Network Event Logging which refers to logs from network address translation. NSEL stands for Network Security Event Logging which refers to firewall logs produced by Cisco ASA. NetFlow v9 is used to transport these logs to the collector but this data cannot be considered as real NetFlow as information provided in NEL or NSEL does not able to reconstruct a real network traffic chart. |
| sFlow | sFlow is an industry standard technology for monitoring high speed switched networks. In contrary to NetFlow this technology does not work with the concept of flow cache and aggregation of metadata extracted from packets to flows. Sampled packet headers are encoded to NetFlow-like format and exported to the collector. Due to heavy sampling rates (usually 1:1000) this data is not accurate enough to handle troubleshooting uses case or network-based anomaly detection. On the other hand, it is easy to produce such data so sFlow standard is supported by entry-level enterprise switches. |
| NetFlow Lite | NetFlow Lite is Cisco version of sFlow with all pros and cons related to this technology. |
| FlowLogs | FlowLogs is a new emerging technology provided by public cloud platforms to enable network traffic monitoring using flow-based approach. FlowLogs are usually provided via special APIs of particular cloud platform provides in CSV like or JSON format which needs conversion to traditional flow formats for collection and further processing on standard traffic monitoring platforms. In Amazon AWS this technology is referred to as VPC FlowLogs. In Microsoft Azure this technology is known as NSG FlowLogs. |
Flow-enabled devices
Network equipment (routers/switches)
Cisco, HP, Huawei, Juniper Networks, Alcatel, Exteme Networks and more
Firewalls, UTMs, load balancers, hypervisors
Check Point, Palo Alto, Sonic Wall, VMware, Kemp load balancers and more
Packet brokers and matrix switches
Keysight, Gigamon, Cubro and more