Flowmon CollectorNetFlow and IPFIX collector with advanced reporting
The NetFlow Collector is a stand-alone appliance for the collection, long-term storage and analysis of flow data from flow-enabled devices (load balancers, switches, and routers), dedicated probes and other flow sources. It is equipped for advanced reporting and data visualization.
Network visibility
NPMD, troubleshooting and capacity planning.
Maximize investment
Leverage devices in your network with support of multiple NetFlow and IPFIX formats.
Use it anywhere
Hardware, virtual or cloud appliance.
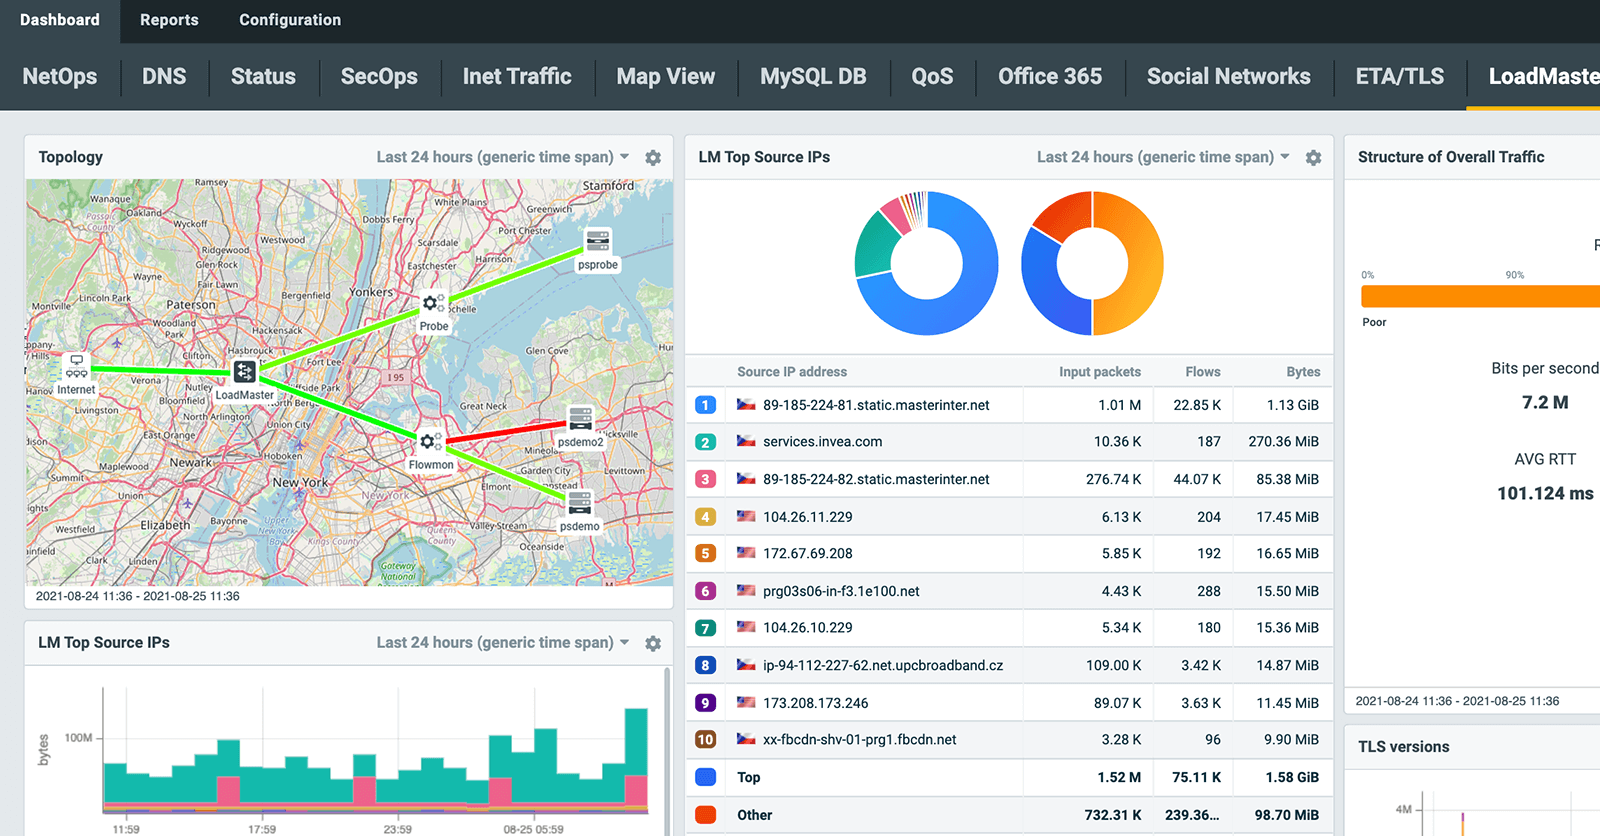
Dashboards and visualization
Highly customizable interface designed for the noise-free visualization of traffic structure, performance metrics and infrastructure topology with flexible and configurable widgets. Use presets built around the most common needs of users (Office 365, G Suite, social networks, DNS, DHCP…) to automate configuration. Whether you are a user or service provider, you can share your dashboard with others.

Analytics drilldown
Drilldown options are available from anywhere on the dashboard. Every widget can be displayed in an analytical view for full detail, down to the level of flows or packets with the ability to view the smallest network activity of devices, flow sources or vendors. You have options to filter by protocols, time periods, source/destination IP address, and more. The statistics are exportable at every level.

Troubleshooting and forensics
The Collector does more than just monitor the red/green status. It tracks individual user interactions with applications to give you an end-to-end understanding of the entire digital environment. This holistic approach allows you to immediately identify the root-cause of problems affecting users and services and take remedial action.

Cloud and SaaS monitoring
Flowmon uses passive network sensors available as virtual appliances in the private and public cloud, accessible from their respective marketplace to inspect all traffic for application-related communications. The Collector tracks the interactions between users and applications to identify bottlenecks anywhere along the application delivery chain.

Bandwidth monitoring
Optimize capacity planning, peering agreements and take control over bandwidth usage. With hard data about top users, devices, applications and services you can make effective decisions to save costs on infrastructure and connectivity.
BYOD monitoring
Monitor BYOD traffic to get visibility and control over connected devices. Passive device fingerprinting allows you to identify the device manufacturer, OS and web browser. Extend this with the real user identity (i.e. username or hostname) by using logs from any authentication system to get more control.
Network traffic monitoring
Ensure the reliability, availability and security of business services with confidence. Flow provides visibility into traffic structure to streamline decision making and save costs on NetOps.
LAN/WAN monitoring
Tune your network performance to its finest with a centralized dashboard. Monitor user activity within different subnets and VLANs, track connectivity, latency and QoS. Get comprehensive east-west visibility, identify different applications and track user transactions traversing LAN/WAN.
Application and network latency
Distinguish between latency caused by server and client. See which users are affected and resolve the problem before it impacts your business. Measure fault, performance and availability of your local, hosted or SaaS applications.

"Thanks to Flowmon, we are provided with network visibility we previously lacked. Now we can identify the causes of network issues easier than ever before." Flowmon answered SEGA's requirements for a high-quality solution for deep insight and fast troubleshooting of network traffic from multiple branches and facilities.

Operations Network Engineer at SEGA

Input data compatibility – NetFlow collector
The Flowmon Collector can process flow data (NetFlow v5, NetFlow v9, IPFIX, sFlow, and many more) from a variety of different network devices – load balancers, routers, switches, firewalls, packet brokers, or dedicated Flowmon Probes.
The IPFIX extensions and proprietary formats of the following vendors are supported: Cisco (AVC, HTTP), Gigamon (HTTP, DNS, SSL, RADIUS), IXIA (HTTP), VMware NSX (rule ID, vmUUID, vncIndex), OneAccess (HTTP), VMware VDS, AWS FlowLogs, Google Could VPC FlowLogs and Azure NSG FlowLogs.
NetFlow collector deployment and capacity options
The Collector is available as a hardware appliance of 1U or 2U rack unit size and a virtual appliance deployable in VMware, Hyper-V, KVM, AWS, Azure or Google Cloud.
Data can be stored for months to years, depending on chosen capacity, from 0,5 TB to 192 TB per appliance. The Collector does not aggregate or sample data – it keeps everything available.
Distributed architecture with multiple NetFlow collectors
Flowmon can be easily scaled by adding NetFlow collectors to cover very large networks spread over multiple distant locations. The central node called Master Unit serves as the main console and storage point where data from all branches is brought together and presented in one dashboard for complete visibility. All the configuration and updates of the whole architecture and its individual nodes is performed from the central NetFlow collector.
Learn more about distributed architectureGet in touch
Do you have question around the solution or want to schedule a call. Write us a message.
Contact usRequest free trial
Get no-obligation 30-day trial of Flowmon in your network.
Get your trial todayMore about Flowmon NetFlow Collector
NetFlow collector FAQ
What is NetFlow collector?
NetFlow collector is a network appliance for the collection, storage and analysis of flow data from flow-enabled network devices (load balancers, switches, and routers) or dedicated probes (sensors).
Why is NetFlow collector important?
NetFlow collector enables infrastructure teams to collect non aggregated network telemetry data unlike other technologies such as packet capture which requires bigger resources for data storage.
Where is NetFlow collector located in network?
NetFlow collector can be hardware appliance sitting in a data centre directly connected to other network appliances. Virtual and cloud NetFlow collectors are being more and more popular with hybrid and decentralised network environments becoming a standard.
How does NetFlow collector collect data?
NetFlow collector receives flow data from flow-enabled connected devices (dedicated probes, load balancers, switches, or routers), normalise and process the data and store them for further analysis. Some NetFlow collectors include UI environment for data visualisation and detailed analysis or pass the data to other analysis tools.