User interface
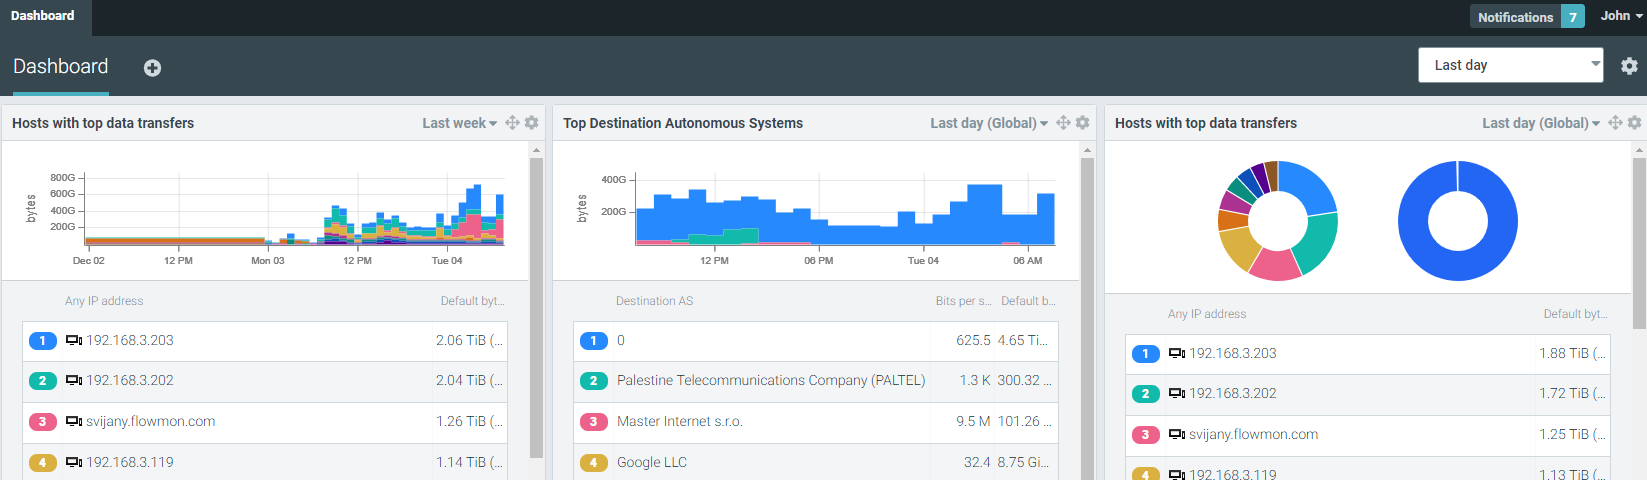
- The Flowmon Dashboard was completely reworked to offer better user experience.
The Flowmon Dashboard was completely reworked to offer better user experience.
- It is possible to create multiple Dashboards which present different view on the network information (e.g. one dashboard for network operation, other for security).
- The size and position of the widgets is now fully customizable.
- Responsive design allows to view dashboard on mobile phones and tablets.
- Update to PHP 7.1. brings improved performance and security of the user interface.
Network performance monitoring
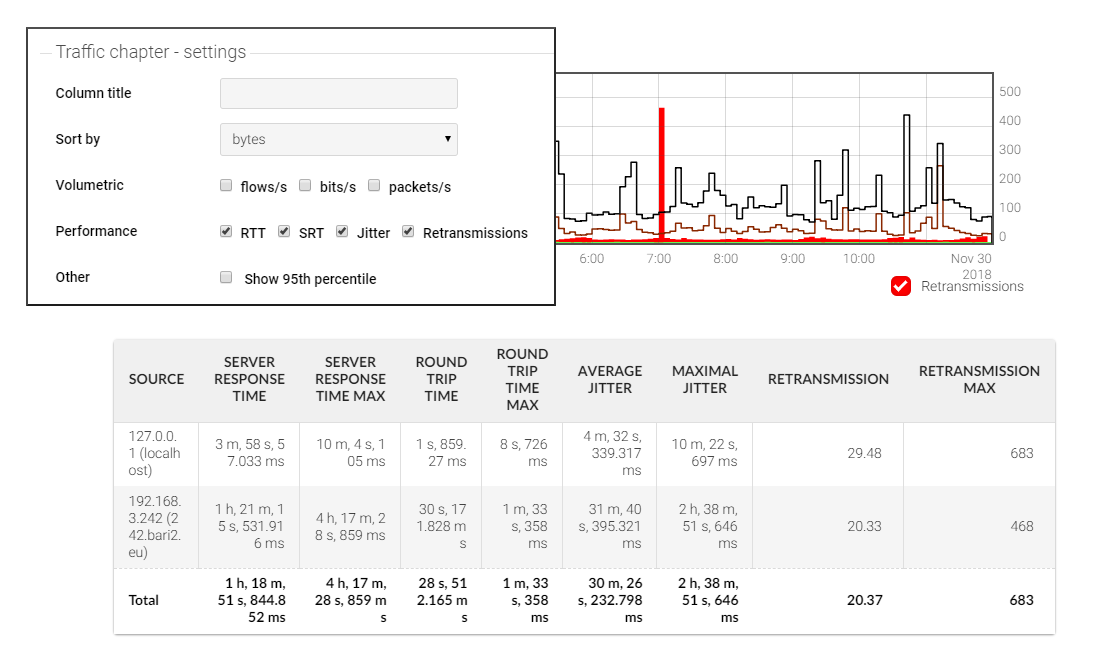
- Calculation of the NPM metrics has been improved. We have updated our internal algorithms. for calculation of the Server Response Time, Out of Order packets and Jitter and Delay deviation. We have also added details on how the metrics are calculated to our documentation.
- Statistics for the Retransmissions NPM metric can be added to traffic chapters and displayed in reports and Flowmon Dashboard.
Reporting
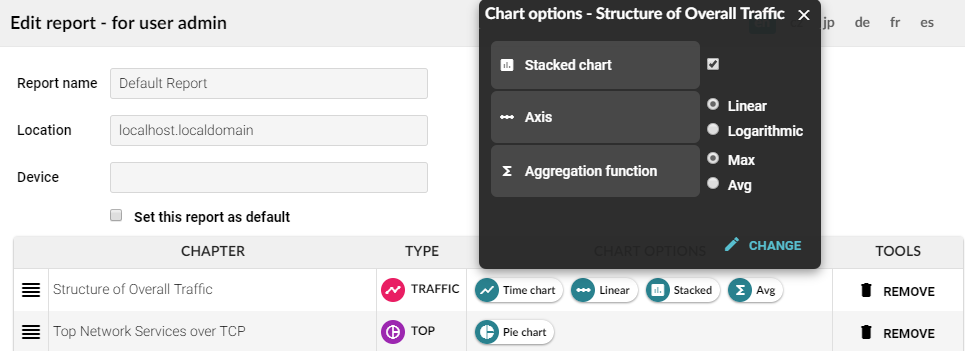
- It is possible to select the individual NPM statics when defining chapter.
- It is possible to switch the aggregation setting for the given chapter from Average to Maximal, it is also possible to switch the aggregation directly on an existing report.
- Percentage column is displayed in the Top statistics.
- NPM metrics are displayed in Profiles /Statistics.
Administration
- VoIP and Active Devices pages have been updated to support multi tenancy. This means that they no longer require the Full access, but that they respect for Sources the permissions assigned to given Role.
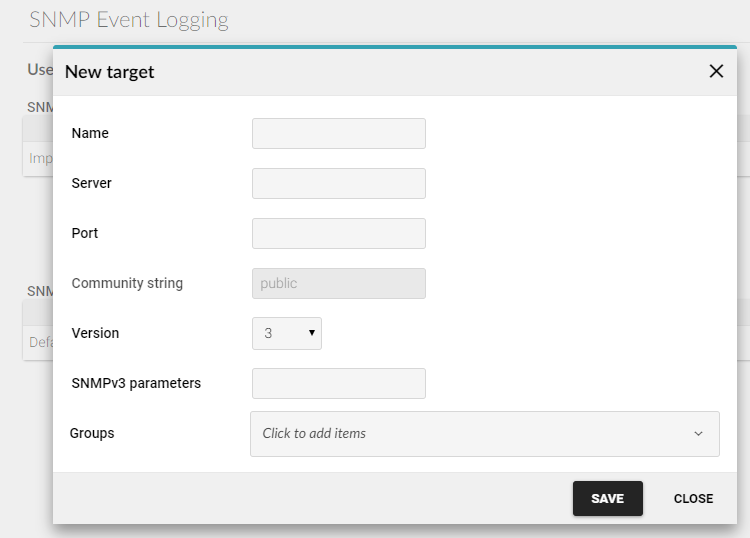
- It is now possible to use SNMPv3 for SNMP event logging.
- Flowmon SSH was updated to OpenSSH 7.4p1-16 and hardened.
- Flow start and flow end timestamps can now be automatically generated in case they are missing. This behavior has to be enabled in the Flowmon Configuration Center -> FMC Configuration -> Listening Ports.
Distributed Architecture
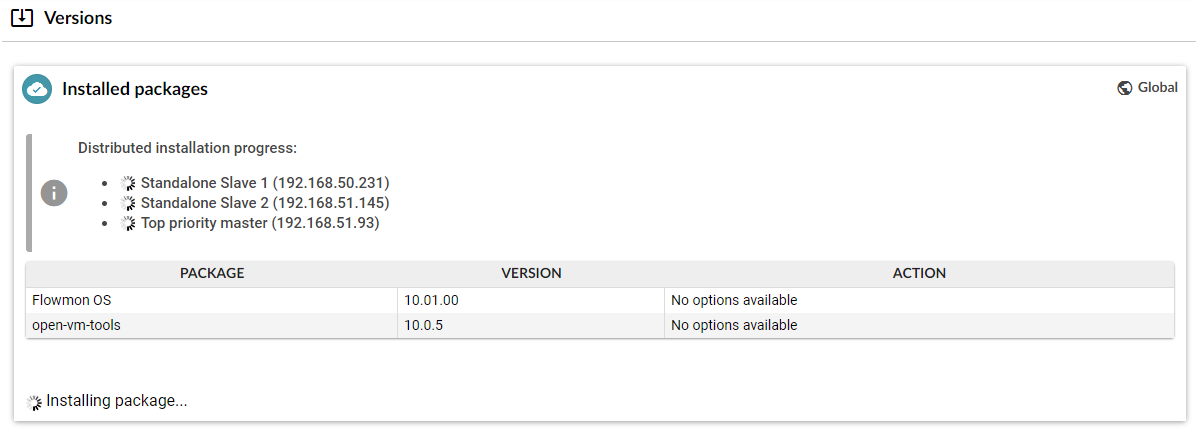
- Updates of all units can now be automatically triggered from the TPM.
- The Show in time feature in Analysis is now supported.
- It is possible to create History profiles; History profile starts and ends back in the past and remains static.
- Quota for the given profile can be defined when the profile is edited.
Other improvements
- Deployment to Microsoft Azure is now supported.
- Cisco NEL statistics reception support was added for IPFIX (for NetFlow v9 it was already supported).
- It is now possible to capture the https hostname information from OneAccess devices.
- It is now possible to capture the 2 byte Next/Previous AS values.
Fixed defects
- Compatibility with Microsoft Edge browser has been improved. Microsoft Edge is now officially supported.
- The calculation of the CPU load displayed in the Flowmon Configuration Center has been fixed.
- For bidirectional traffic the "Transferred" column was renamed to "Input Bytes" in the Flowmon
- Dashboard and Flowmon Monitoring Center.
- NPM channels names are displayed correctly in the CSV export.