From the perspective of network administrator and operator, the fundamental requirements for network applications are the same regardless of the environment they are running in. They need to have their network communication fast, reliable and secure. To meet these requirements, we need to have relevant data about the application traffic.
For this purpose, the flow data from Progress Flowmon Probes fits greatly with a slight difference in comparison to the flows generated in a standard network. It is necessary to correlate the flow data with particular network applications or services running in Kubernetes (k8s). For this purpose, we use k8s metadata rather than relying on IP addresses, as pods are regularly created and destroyed meaning that the traffic for a specific application can be made up of many different IPs in a short period of time. It's also likely that the same IP address will be associated with multiple applications in a limited period of time.
Data Model
For this reason, we have created a customer validated data model for reliable application identification in k8s environment, which comprises of the identification of the k8s cluster, namespace, pod and deployment. Specifically, we are providing the following information fields in the flows added as a custom extension:
- K8s node name and IP - ID of the k8s node related to this flow. Can be used for k8s cluster identification and for isolation of node-based issues like network or hardware problems.
- Pod name and namespace - Name of the pod and deployment related to this flow.
- Pod labels - Pod labels for lookup of a specific application group.
- Pod annotations - Pod annotations for lookup of a specific application group.
Observation Points
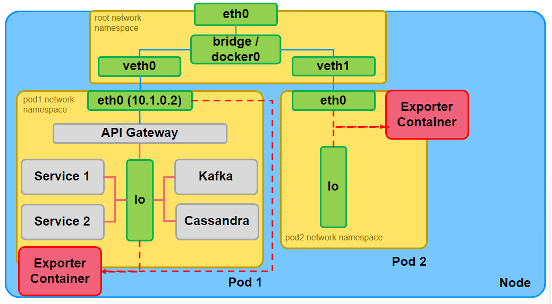
Selection of the right observation point is also crucial in order to obtain the right data. In k8s, the standard solution for access to the application traffic is to deploy a side car container into its pods (Exporter container on the above figure). Such an observation point provides access to the north-south traffic (egress and ingress traffic of the pod) and even to the east-west traffic (traffic between containers inside the pod). Based on our customer validated data, it is obvious that the north-south traffic provides the right amount of detail as the east-west would be too overwhelming. It is also useful for application debugging rather than for its operations.
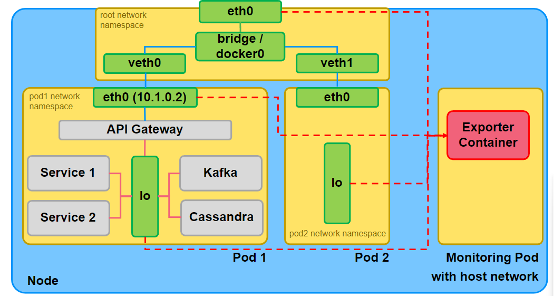
Another observation point for k8s is on the node level running as a privileged Monitoring Pod (on the prior figure) with access to the host network. Such pods have access to the north-south and east-west traffic of all pods (by monitoring their respective network namespaces) and the node’s traffic. This provides visibility into the k8s service communication and valuable traffic and performance metrics for the cluster operations team. However, this approach requires full-privileged access to the k8s node and its host network and has a more complex deployment. In this article, we will focus only on the sidecar-based observation points.
Sidecar Deployment Model
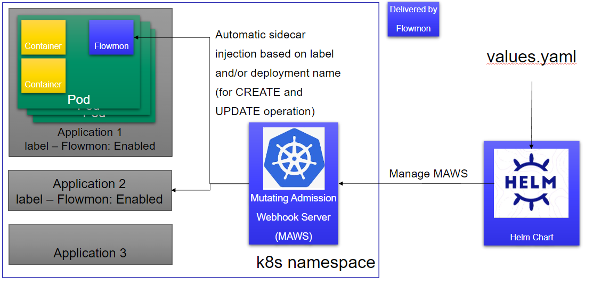
The Flowmon Probe for Kubernetes is now in the alpha stage. Customers or partners interested in testing the Flowmon Probe for Kubernetes will be provided with a package containing container images (they are not yet distributed via repo in this phase), k8s deployment patch for adding the Flowmon container as a sidecar, Mutating Admission Webhook Server (MAWS) for automatic patching of customer applications selected for monitoring and Helm chart for easy installation and deployment of the MAWS. In the self-managed k8s environment, teams can use the Helm chart to deploy the MAWS. First, they need to define a few variables in values.yaml file, to provide important configuration data for Flowmon Probe, like collector IP and port, k8s deployment label and/or deployment name for application identification, SSL keys for MAWS HTTPS server etc. Then they can install the Helm chart to deploy the MAWS. From that moment all new or updated pods matching the provided deployment name and/or having the provided label set will be automatically patched with the sidecar container that will export IPFIX flows about the pod's traffic to the collector.
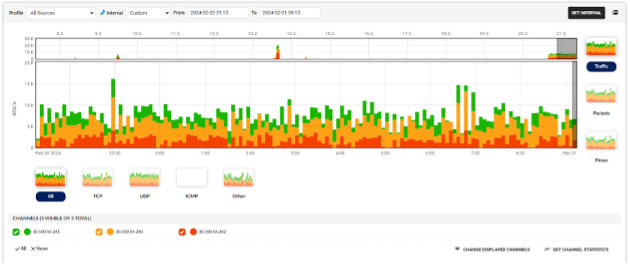
Below, you can see the k8s traffic on the collector. Each color represents traffic from all monitored pods on a single k8s node.
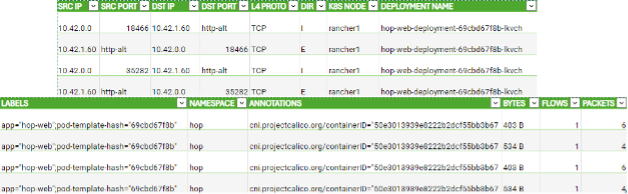
Below you can find an example of flows exported from k8s application.
However, the solution with MAWS is not suitable for users in managed k8s-as-a-service (KaaS) environments as the k8s webhooks are deployed globally which usually is not allowed for users of KaaS environments. Such users are required to patch their deployments manually or if they are using e.g. Kustomize, create a component that will patch it for them.
If you want to test the alpha version of Flowmon probe for Kubernetes, contact our Flowmon Product Management team, namely Nick Vlasov ([email protected]).