With the introduction of Loadmaster’s Network Telemetry feature it’s never been easier to get network and application insights for your applications using Flowmon. In this article we’ll walk step-by-step through configuring Flowmon to highlight all the critical traffic types that flow through Loadmaster.
With any monitoring solution one of the key factors to gaining value from it is being able to surface key insights and data when and where you need them. With that in mind we’re going to show you how to setup up your Flowmon deployment to capture and display critical traffic flowing through your Loadmaster clusters as well as isolate individual applications. We’ll be able to breakdown essential network performance metrics such as Server Response Time (SRT), Round Trip Time (RTT) and retransmissions by server and client segments.
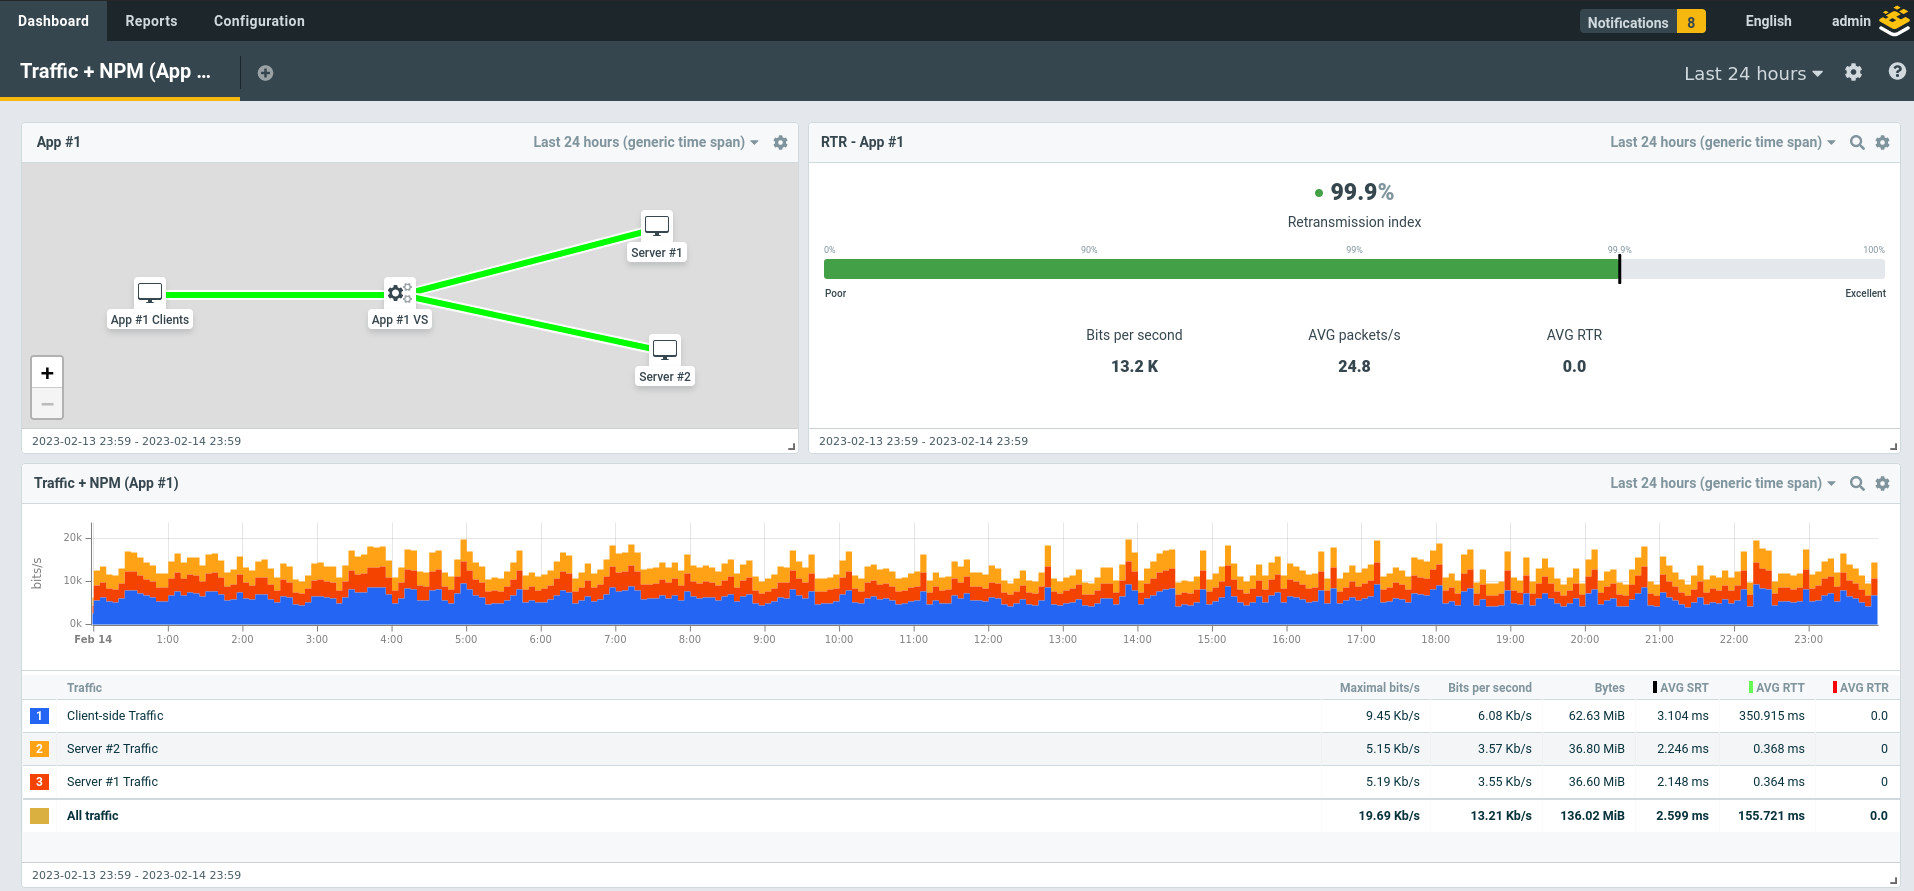
When we’re finished, you’ll be able to build application specific dashboards like that shown below.
Configuring Your Loadmaster
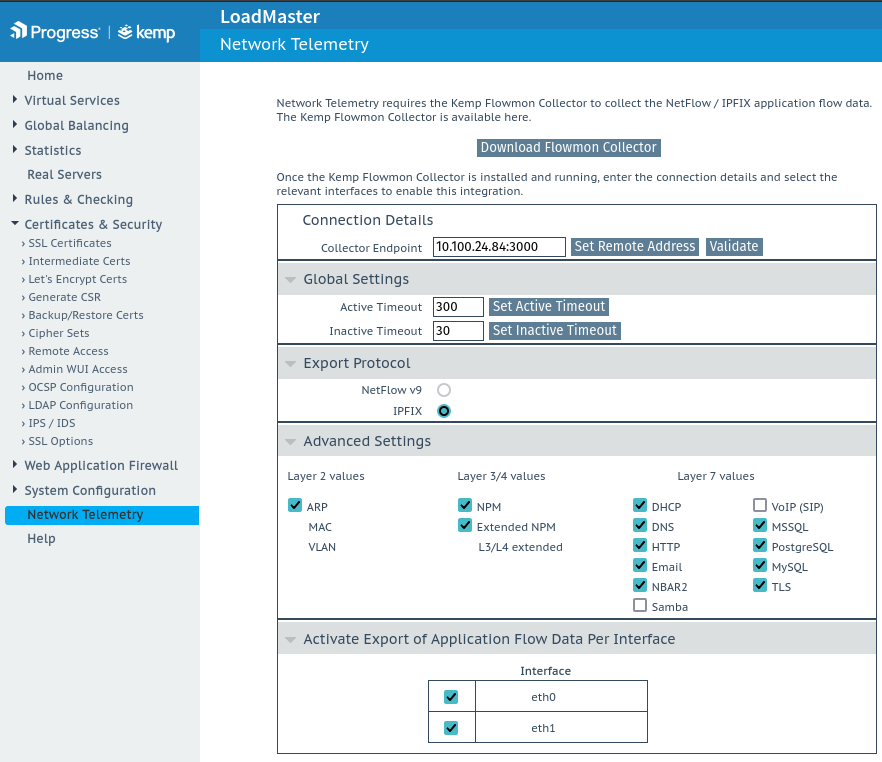
The first step is to enable the Network Telemetry feature on your Loadmaster. In this guide we’ll be assuming you’re using a High Availability (HA) cluster, so you’ll need to log into the shared cluster IP to access this feature. If you’re using a standalone unit just login to the Web UI (WUI) as normal.
Enable Network Telemetry and insert the IP address of your Flowmon Collector as well as the listening port number. If you’re unsure what the port number is just use the default which is 3000. Leave all the other settings.
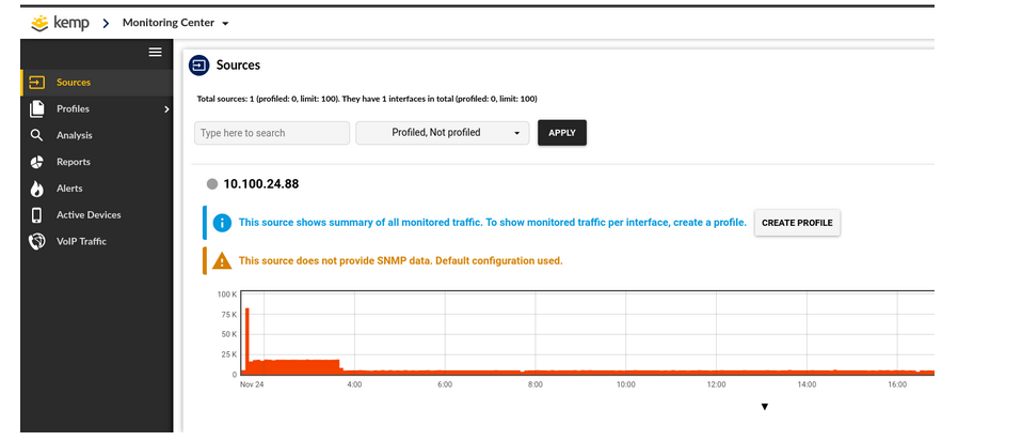
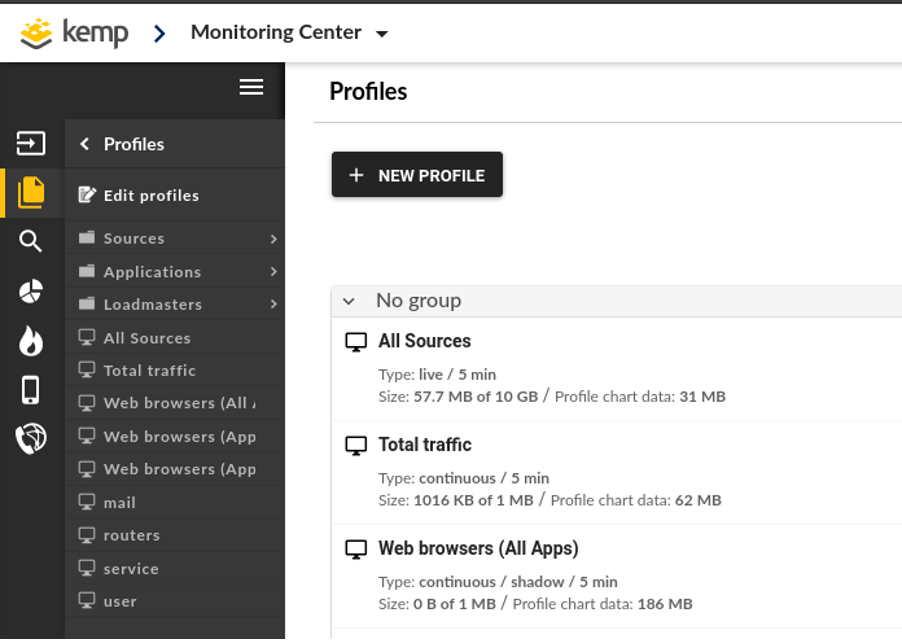
When this is completed you should be able to see the Loadmaster HA cluster IP (or standalone unit IP) listed under “Sources” in the Flowmon Monitoring Center WUI. In the lab used for this post this is IP address 10.100.24.88 as shown below.
Building Your Loadmaster Traffic Profiles
There are two main ways we can look at our Loadmaster traffic that make identifying key trends and issues easier. The first is looking at the Loadmaster cluster allowing us to identify performance trends and issues across the entire cluster. The second is looking at each application being published by the Loadmaster individually and allow us to see trends impacting a single application.
For each Loadmaster cluster (or standalone unit) we will capture the following traffic types:
- Client-Side Traffic – this is all traffic from application clients to any virtual service hosted on the cluster.
- Server-Side Traffic – this is all traffic from the Loadmaster cluster to real servers from every virtual service hosted on the cluster.
- HA Traffic – this is the traffic between the two HA units in a cluster that they use to manage and synchronise the cluster. This traffic can often relate to performance issues in the cluster.
Then for each Application being published we’re going to capture traffic specific to it:
- Client-Side Traffic – this is any client traffic to a specific virtual service
- Server-Side Traffic – this is any Loadmaster traffic to real servers for a specific virtual service and this time we’re going to break it down by individual servers.
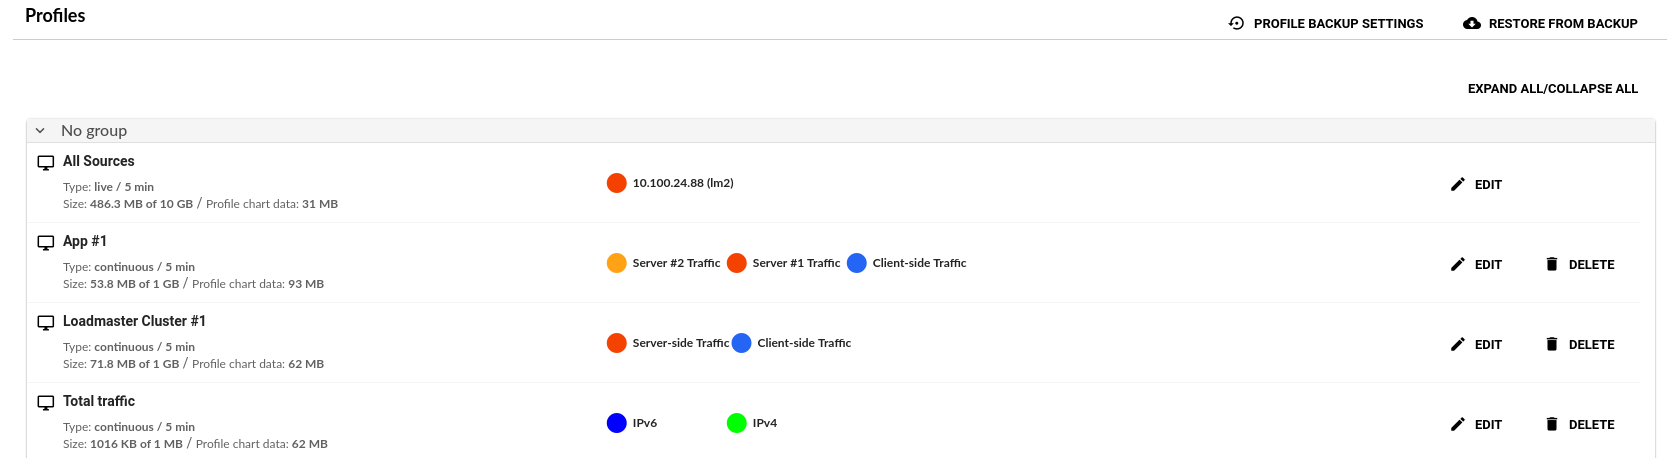
When we have finished we will have a profile for the Loadmaster cluster and another for our Application.
Creating Your Profiles
To create a new Profile in Flowmon Monitoring Center you go to Profiles -> Edit profiles and click New Profile.
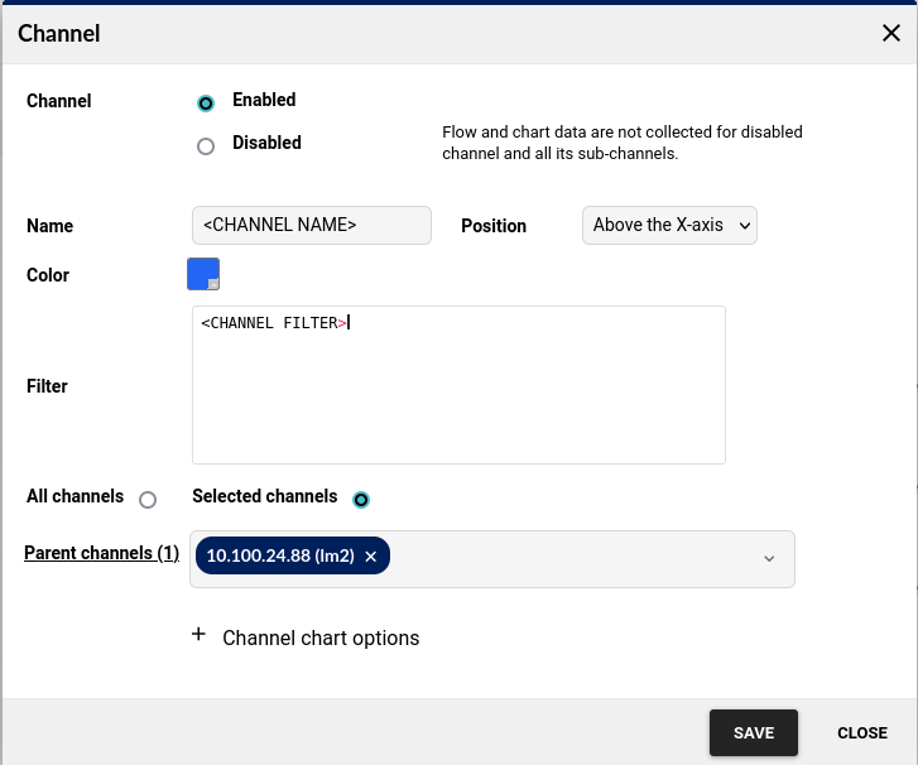
Before we get into the details of each channel the image below highlights the key elements we want to use for every channel we make.
<CHANNEL NAME> - the name of the channel which will show up in any other configurations, charts, dashboards or reports.
<CHANNEL FILTER> - this is what will enable us to capture only the relevant traffic and will contain environment specific variables unique to your configuration.
Selected Channels & Parent Channels – this is especially important that you change the default All Channels to Selected Channels and then remove any other channel from Parent Channels except for the Loadmaster cluster your capturing traffic from (in our example lab that is 10.100.24.88 as seen below). If not, you may end up with duplicate or missing traffic in your Profile.
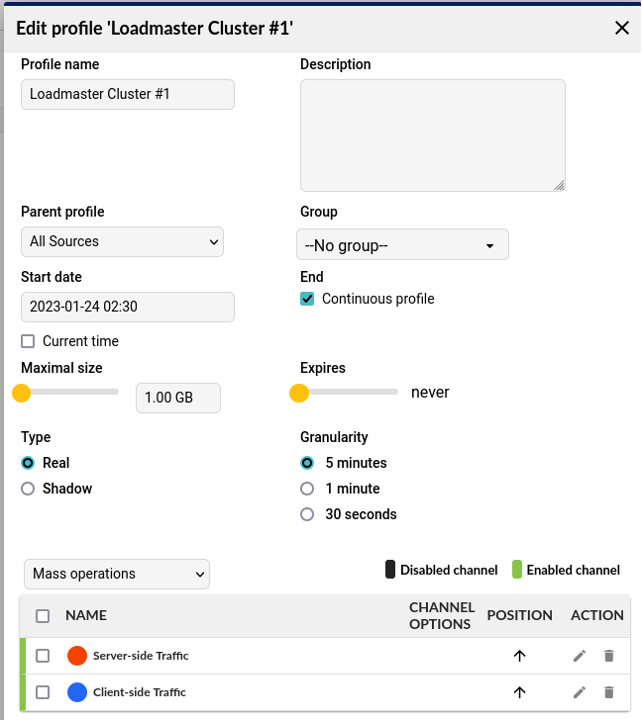
Loadmaster Cluster Profile
For our first profile we’ll do our Loadmaster HA Cluster. We’ll call it “Cluster Traffic”.
We then need to add our three channels – Client-Side Traffic, Server-Side Traffic and HA Traffic.
To add a new Channel, click the New Channel button in the New Profile pop-up, complete using the details below and click Save.
Client-Side Traffic
For this channel we want a filter to capture all traffic to and from any virtual service on our cluster.
To do this we will create the filter fragment below that can then be repeated for every virtual service. The whitespace is purely for legibility.
Fragment per Virtual Service:
(((dst ip <VIRTUAL SERVICE IP>) and (dst port <VIRTUAL SERVICE PORT>)) or
((src ip <VIRTUAL SERVICE IP>) and (src port <VIRTUAL SERVICE PORT>)))
In our lab we have two virtual services which share an IP address but use a different port:
- Virtual Service 1: 10.100.24.87:80
- Virtual Service 2: 10.100.24.87:8080
So, the channel filter for our example lab will be:
(((dst ip 10.100.24.87) and (dst port 80)) or
((src ip 10.100.24.87) and (src port 80))) or
(((dst ip 10.100.24.87) and (dst port 8080)) or
((src ip 10.100.24.87) and (src port 8080)))
It can be tempting to try and simplify this type of filter to just use ‘ip’ to capture bi-directional flows and in some environments, this will work the same as the above but in other cases it will capture unintended traffic, so we’ve been very strict in our filters to make them suitable for the widest range of environments.
Server-Side Traffic
Next, we want to capture all traffic between the Loadmaster cluster and all real servers for every virtual service. Again we will start with a filter fragment we can repeat for each real server we want to capture.
Fragment per Real Server:
(((dst ip <REAL SERVER IP>) and (dst port <REAL SERVER PORT>)) or
((src ip <REAL SERVER IP>) and (src port <REAL SERVER PORT>)))
In our example lab we have two real servers shared across the two virtual services but again on different ports. On our second virtual service, the real server ports are different from the virtual service port. Rather than try to aggregate them we will just treat them as four different real servers in our filter using the fragment above.
- Real Server 1 – 10.20.20.10:80
- Real Server 2 – 10.20.20.100:80
- Real Server 3 – 10.20.20.10:8443
- Real Server 4- 10.20.20.100:8443
Now we can build our channel filter:
((((dst ip 10.20.20.10) and (dst port 80)) or
((src ip 10.20.20.10) and (src port 80))) or
(((dst ip 10.20.20.100) and (dst port 80)) or
((src ip 10.20.20.100) and (src port 80))) or
(((dst ip 10.20.20.10) and (dst port 8443)) or
((src ip 10.20.20.10) and (src port 8443))) or
(((dst ip 10.20.20.100) and (dst port 8443)) or
((src ip 10.20.20.100) and (src port 8443)))
You can see that these filters grow quite large very quickly which is why using a fragment that can be cut-and-pasted repeatedly and reliably can reduce errors even if they may seem “inefficient” in small use cases.
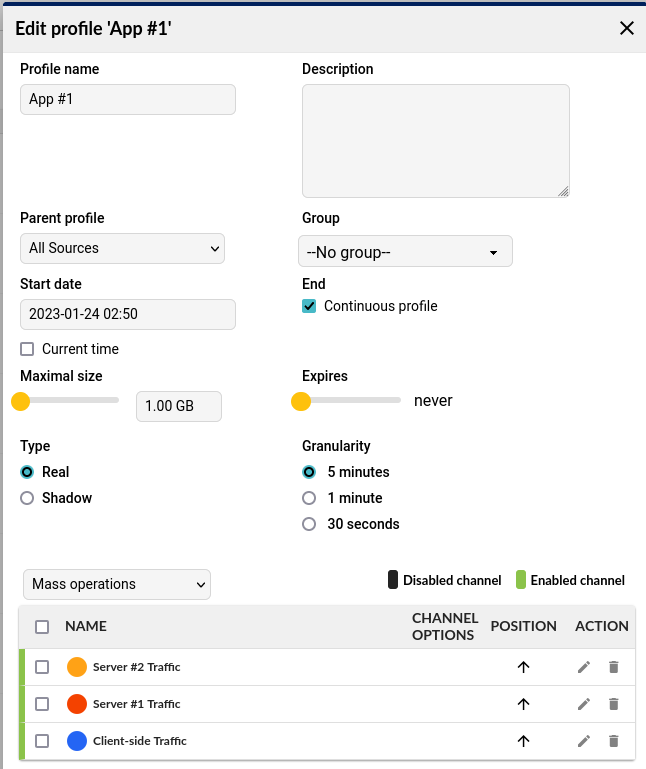
Application Profile
We’ll now create a profile for each Application that is being delivered by the Loadmaster Cluster. This will be quite like the Cluster profile in that we focus on both client-side and server-side traffic but in this case we will breakdown the server-side traffic on a per-server basis.
Client-side Traffic
In this channel we want to capture all clients connecting to a given virtual service. If an Application uses multiple virtual services you can join the fragment below together using an ‘or’ operator.
Virtual Service fragment:
((dst ip <VIRTUAL SERVICE IP>) and (dst port <VIRTUAL SERVICE PORT>)) or
((src ip <VIRTUAL SERVICE IP>) and (src port <VIRTUAL SERVICE PORT>))
So, for our first Application in our lab environment using the virtual IP 10.100.24.87 and port 80 our filter would be:
((dst ip 10.100.24.87) and (dst port 80)) or
((src ip 10.100.24.87) and (src port 80))
Server-side Traffic
In the case of a single Application we could capture all server-side traffic in a single channel as we did at the cluster level but it’s much more useful to do so on a per real server basis. This allows us to capture problems at an individual server level. Remember that the filter below is designed to be used for a channel per server, not as a fragment to be repeated per server in a single channel.
Per Server Channel Filter:
((dst ip <REAL SERVER IP>) and (dst port <REAL SERVER PORT>)) or
((src ip <REAL SERVER IP>) and (src port <REAL SERVER PORT>))
In our lab Application 1 has two real servers, 10.20.20.10 and 10.20.20.100, both listening on port 80. In our case we will create two separate channels, one for each server and the filter for the Server 1 channel would look like this:
((dst ip 10.20.20.10) and (dst port 80)) or
((src ip 10.20.20.10) and (src port 80))
The filters shown above are the simplest and most generally applicable but there are scenarios where this filter will capture other unwanted traffic because multiple Applications are being hosted on the same servers using the same ports (i.e., web hosting scenarios). In these scenarios layer-7 information such as the SNI or HTTP hostnames can be added to the filters to separate applications. If that isn’t possible and each application uses its own virtual IP, Transparency is disabled and Subnet Originating Requests is also disabled then the Virtual Service IPs can be used as unique client IPs to distinguish the traffic originating from different virtual services.
Using your Loadmaster Traffic Profiles
Now that we have profiles created for our Loadmaster cluster as well as each Application we have the full scope of Flowmon features available to gain per cluster and per application insights. We can apply NPM and Web Browser presets to quickly build dashboards or we can build topologies to get an overview of our complete application infrastructure at a single glance.
If we navigate to Dashboards & Reports -> Configuration -> Presets we will be presented by dozens of Presets that allow us to generate Dashboards and Reports suited to different application and traffic types.
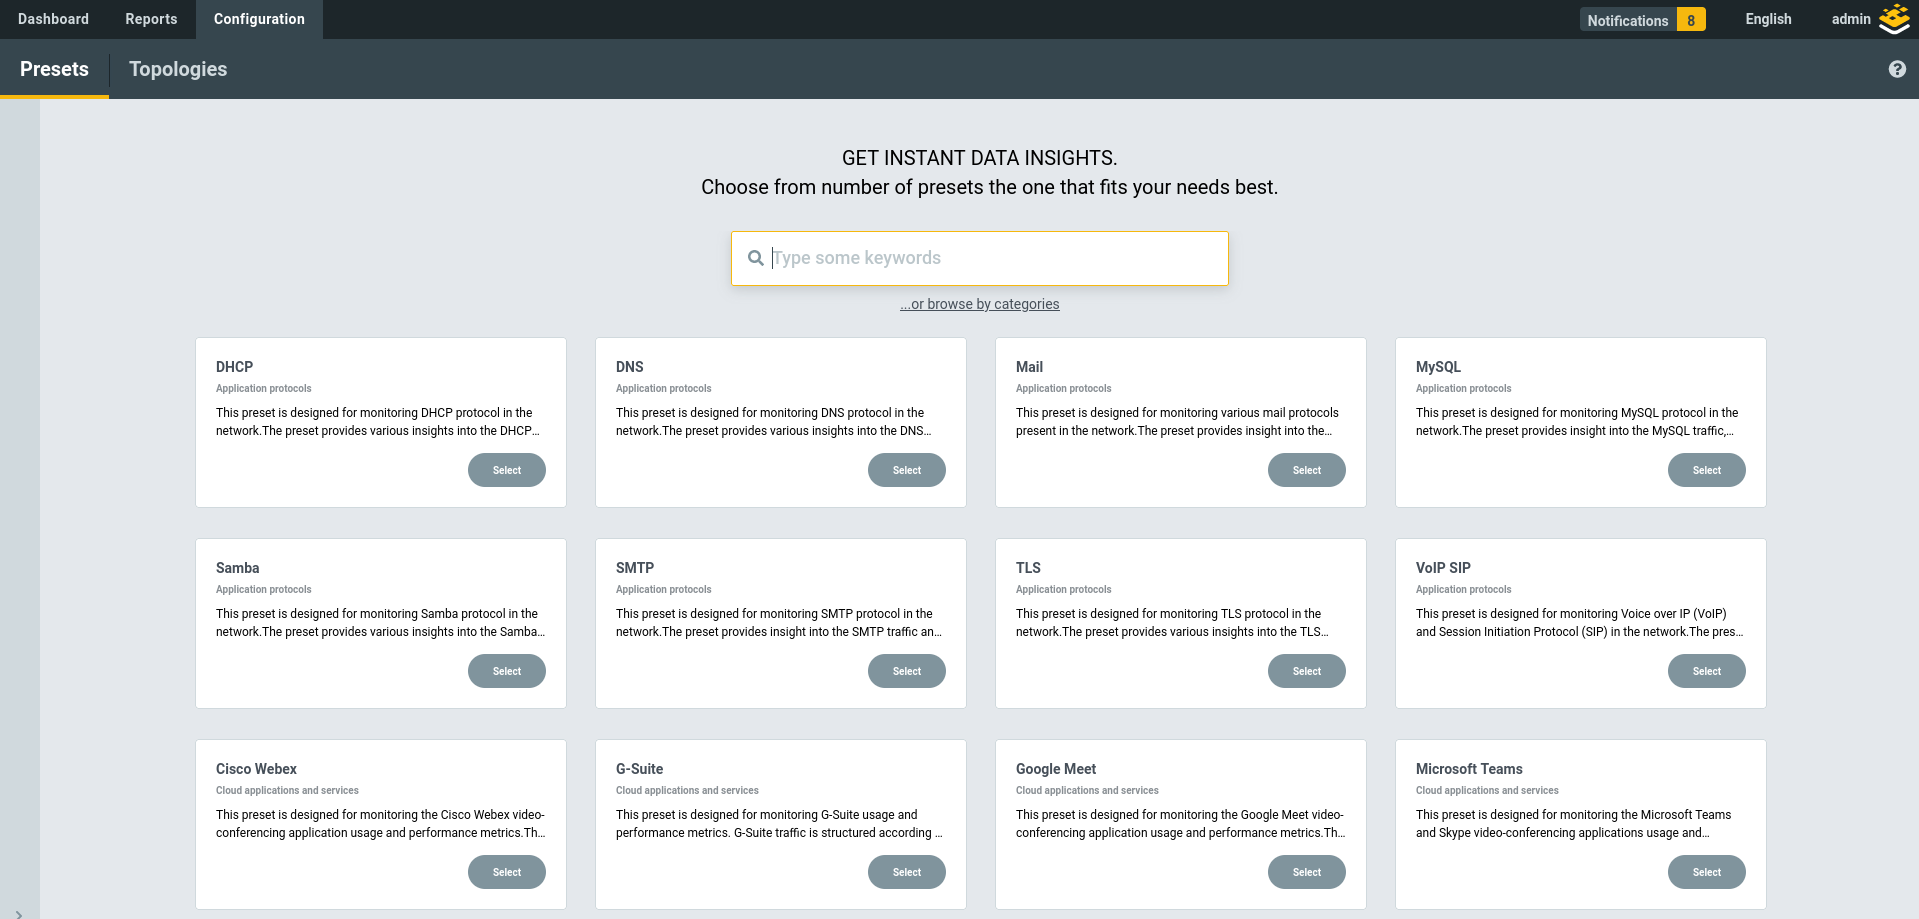
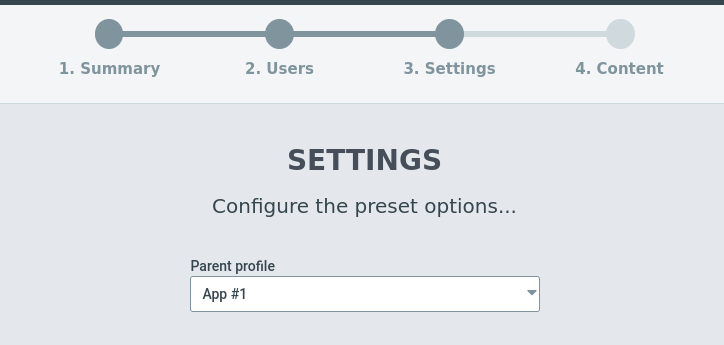
In this scenario we’re going to use the Traffic + NPM preset. Accept the defaults except when you get to Step 3 (Settings). Here we want to select ither our Loadmaster Cluster profile or our Application Profile. We’ll use App #1 from our example.
Before going to our NPM Dashboard for App #1 we’re also going to go into Dashboards & Reports -> Configuration -> Topologies and build a topology view of our application. Once all this is completed we can add the topology to our default NPM dashboard (created by the Preset) and we’ll be able to start gaining key insights and we are now able to display our dashboard we introduced at the beginning.
Summary
The Loadmaster Network Telemetry feature makes it easier than ever to get key insights on your applications into your Flowmon deployment. By creating both cluster-wide and application specific channels you can quickly build NPM dashboards and topologies that surface essential performance and availability metrics broken down by application, client and server.