In this blog I would like to share with you some tips and tricks that you can use when investigating network anomalies in Flowmon ADS.
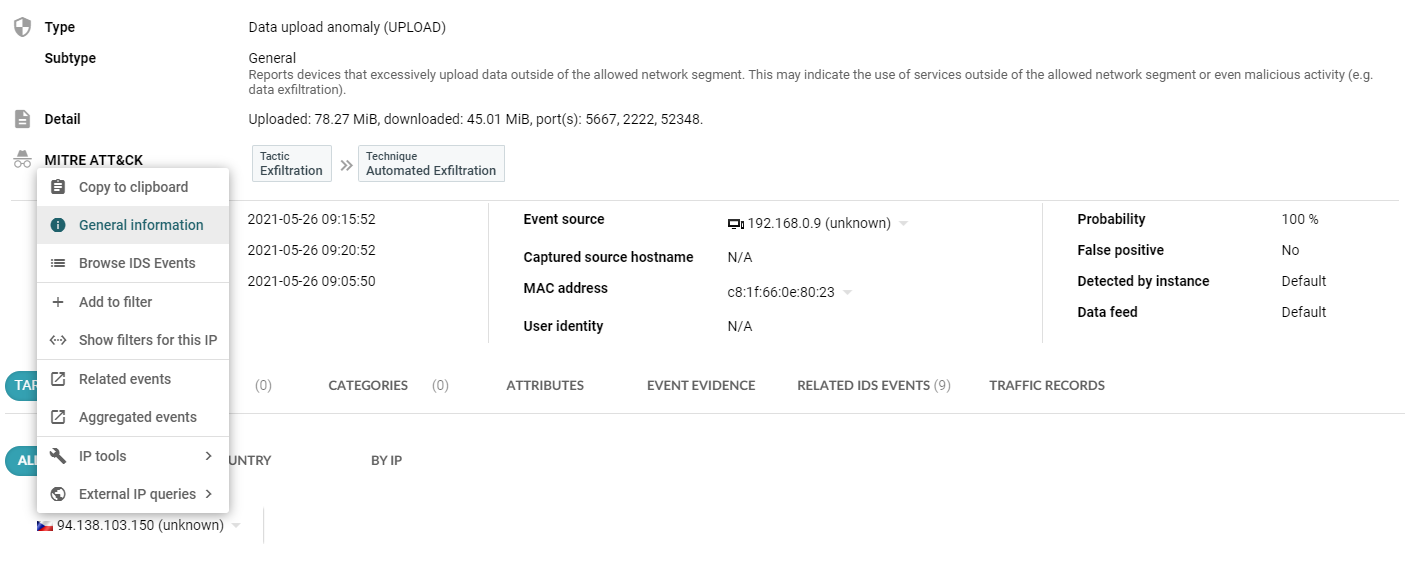
As an example, I will use a data exfiltration event (data upload anomaly) that was detected in a customer environment. Event details reveal 78MB uploaded and 45MB downloaded from an unknown external IP address on unexpected ports.
First thing to focus on is the external IP address and built-in feature “General Information” that will bring up information from WHOIS records to understand which network range the IP address belongs to and which entity operates the IP address. While this may help you to get first insight you still need more details to understand the purpose and origin of the network traffic.
Figure 1 – Selecting more details on event target from the context menu in the event detail
As a next step, you can investigate network telemetry (NetFlow/IPFIX) records associated with the anomaly, which we refer to as “Event Evidence”. Even with encryption in place you still may get information such as server name indication (SNI) to find out the destination domain/host name.
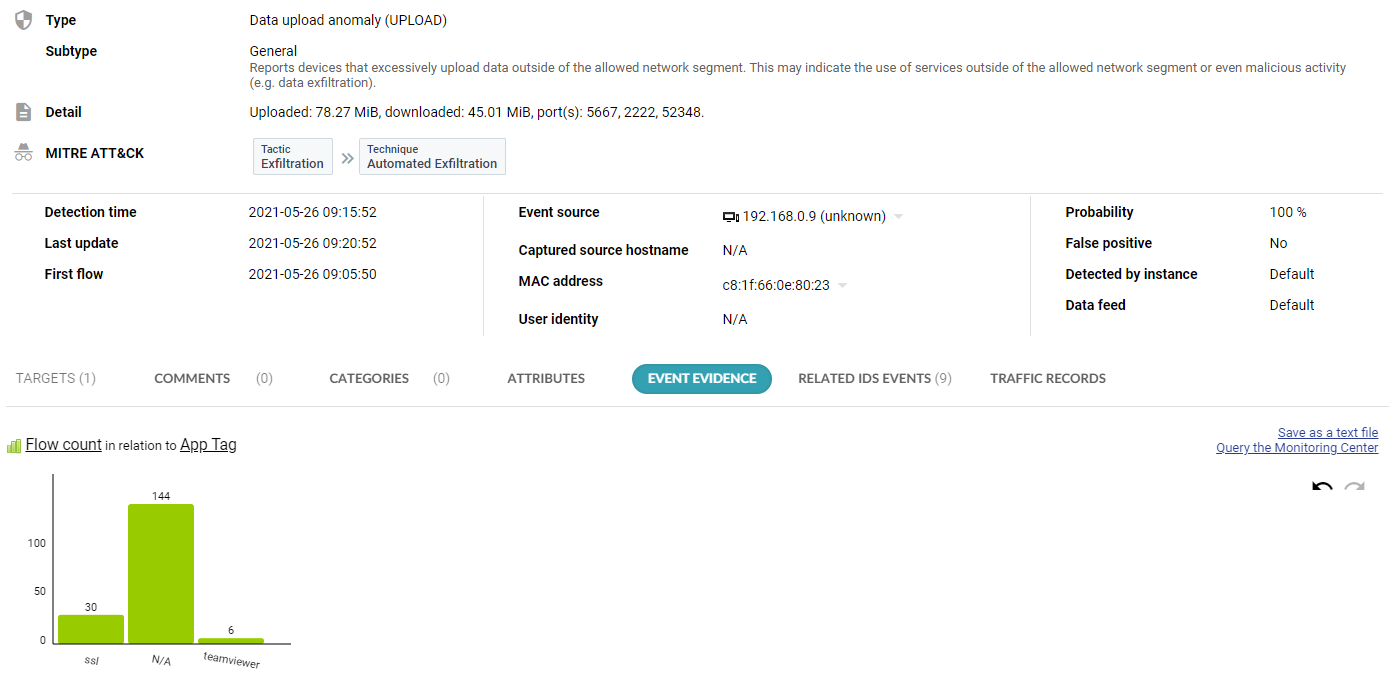
Unfortunately, in this case we are out of luck. However, anomalies may be composed of a variety of different network sessions and therefore the histogram visualization can help you to understand the structure of the network traffic related to data exfiltration. In the figure below, flow count in relation to application tag was selected to give us this information. You have the option to configure both the X and Y axis of the histogram leveraging various attributes of network telemetry data to understand the traffic structure and even to filter flow records by clicking on a column in the histogram. In this case we understand that the traffic is composed of a network session encrypted with TLS/SSL, TeamViewer sessions and other traffic that cannot be attributed to any known application protocol.
Figure 2 – Traffic histogram visualization in Event evidence
Another level of insight may be provided by intrusion detection signatures. When Flowmon IDS Probe based on the open-source Suricata IDS is being used, Flowmon ADS can display all the related events exposed by intrusion detection using packet-based signatures as additional context and information enrichment for the network anomaly being investigated. In this case, however, we are again out of luck, as no relevant signature that might give us additional information matched the network traffic. The IDS Probe is a free of charge software extension/module of Flowmon Probe that comes with community signatures while providing the option to use commercial Suricata signatures from third party vendors.
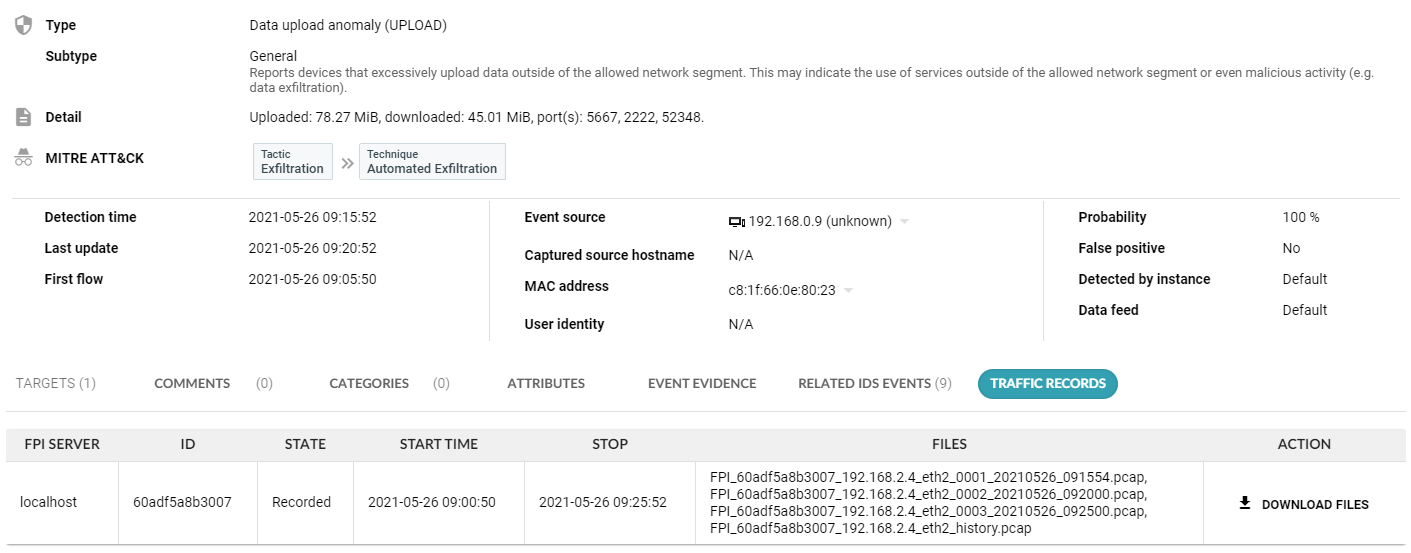
The ultimate investigation technique is packet analysis. When Flowmon Packet Investigator is in place, on-demand selective packet capture is available. Flowmon ADS integrates with the Packet Investigator and when a high-severity anomaly is detected, it will trigger the packet capture to provide full packet trace for subsequent forensic analysis. This includes an in-memory packet buffer to make sure no important packets are missed. Flowmon Packet Investigator is an additional software module for Flowmon Probe (traffic capture) and Collector (capture control and packet analysis).
Figure 3 – Traffic recording available in event detail
As the traffic is encrypted, we might still not get the information we need, leaving aside how cumbersome packet analysis may be. Therefore, there is another trick you may use to combine information from various network protocols and stich the individual pieces together. Ultimately, we are seeking to uncover the real domain behind the external IP address that was contacted by the network device in our environment. The answer to this question is hidden in DNS traffic where you can leverage the ability of Flowmon Probe to extract metadata from the DNS protocol and analyze DNS metadata using Flowmon Collector.
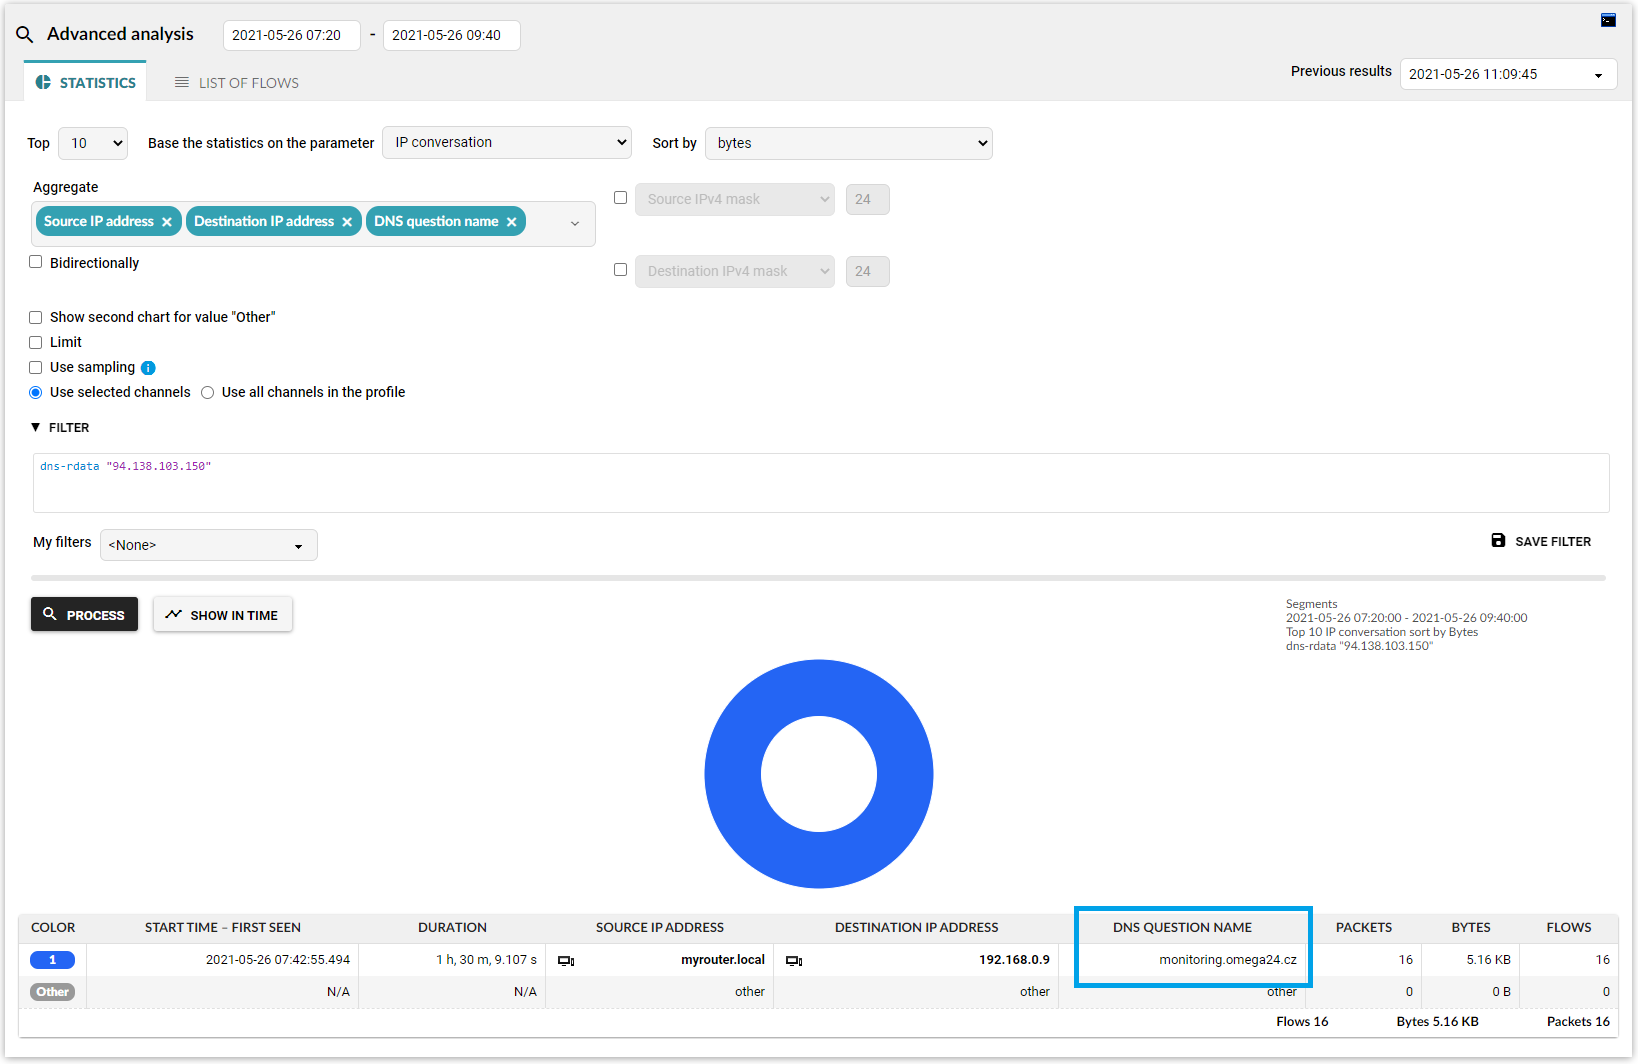
For this type of analysis, you switch from the Anomaly Detection System to the Monitoring Center where you can run any query on primary network telemetry data using specific filtering. In this case you want the DNS question name for DNS response data containing the external IP address. Therefore, the following filter is applicable:
dns-rdata "94.138.103.150"
The result of the query will tell you that a local router acting as a DNS server resolved the domain “monitoring.omega24.cz” for internal IP address “192.168.0.9” which is exactly the information you were looking for and with this specific knowledge you can conclude the investigation.
Figure 4 – DNS question name filter in the Monitoring Center
Spoiler alert – we are working on a technique for automated attribution of the DNS metadata to network traffic so we can provide this information out of the box as part of event details without the need for manual analysis. This technique will help to provide more insight into encrypted traffic where server name indication is not available, since DNS can be a viable source of this information.