Historical Trends is a new functionality introduced with Flowmon 12.3 that will enable you to easily compare your current network traffic with historical values and gain new valuable insights.
What are Historical Trends
Historical Trends are crucial in network monitoring because they provide context into the network and infrastructure performance affecting business critical services and user productivity. By analysing historical data, you can identify patterns, anomalies, and recurring issues that might not be apparent from real-time monitoring alone. This historical perspective helps in several ways:
Problem detection: By comparing current traffic volume metrics with historical data, you can quickly detect deviations from expected norms. This aids in identifying potential issues early, before they escalate into major problems.
Tracing back and bandwidth analysis: Historical data allows you to trace back the origins of performance bottlenecks or outages. It helps in understanding whether bandwidth utilisation issues are isolated incidents or part of a recurring pattern, enabling more accurate root cause analysis.
Data-driven capacity planning: By studying historical trends, you can anticipate usage spikes or seasonal patterns, enabling you to make better choices allocating resources effectively, making technology upgrades and optimisations to avoid degradations during peak periods.
Reporting and compliance: Historical data is often required for compliance purposes and reporting. It helps organisations demonstrate how well they meet expectations and regulatory requirements over extended periods.
How to use Historical trends in Flowmon 12.3 and later
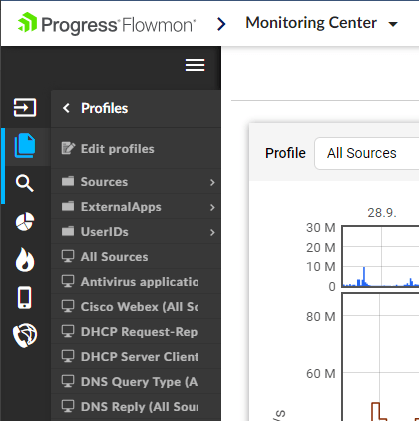
First navigate to desired profile in Flowmon Monitoring Center as you can see in the picture below - Monitoring Center > select Profiles > click the desired Profile link >
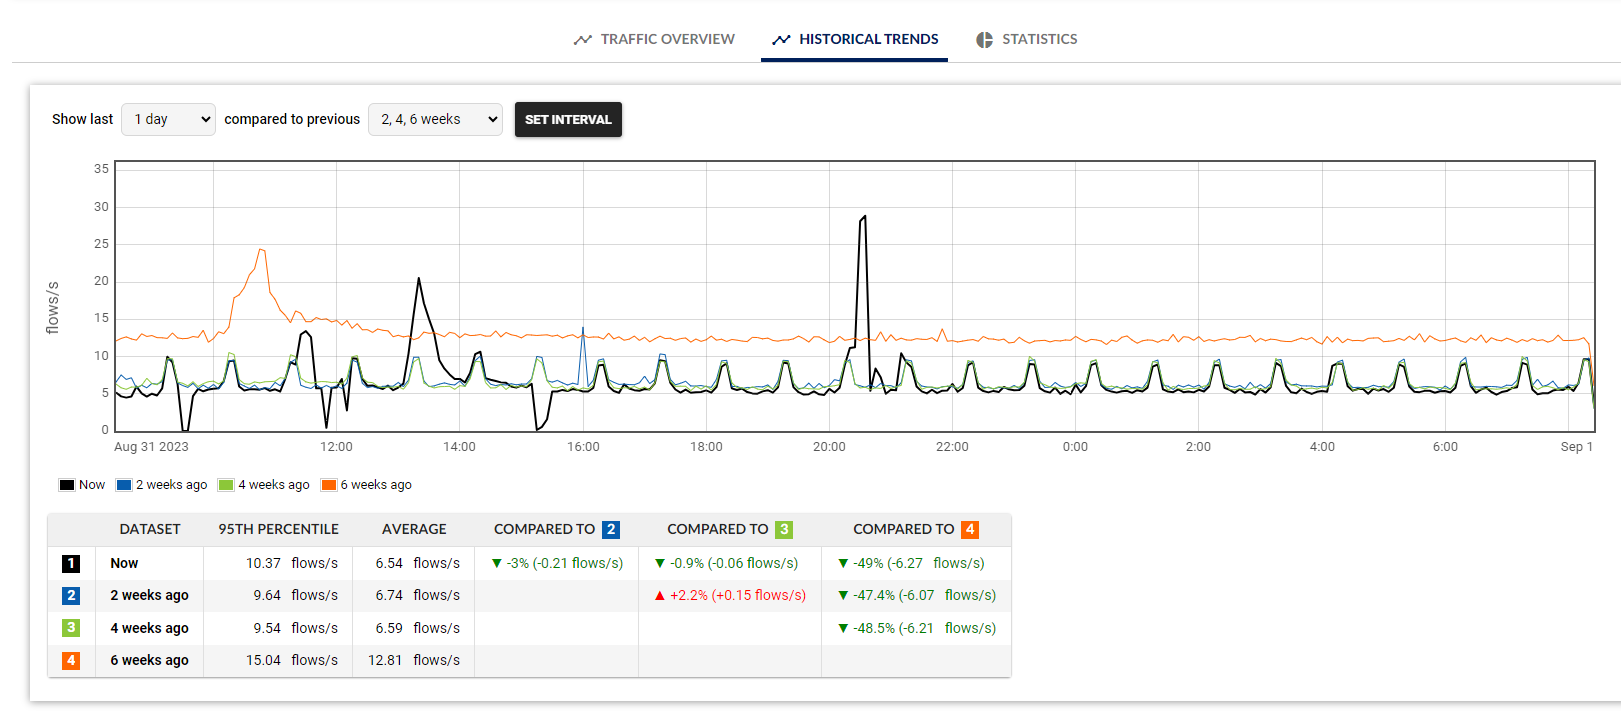
Then switch from "TRAFFIC OVERVIEW" to "HISTORICAL TRENDS" in the middle above the chart as you can see in the picture below.
In Flowmon Monitoring Center, in the traffic chart on the Analysis page you will find “3 Week Average” which will tell you how is your traffic doing compared to the previous 3 weeks.
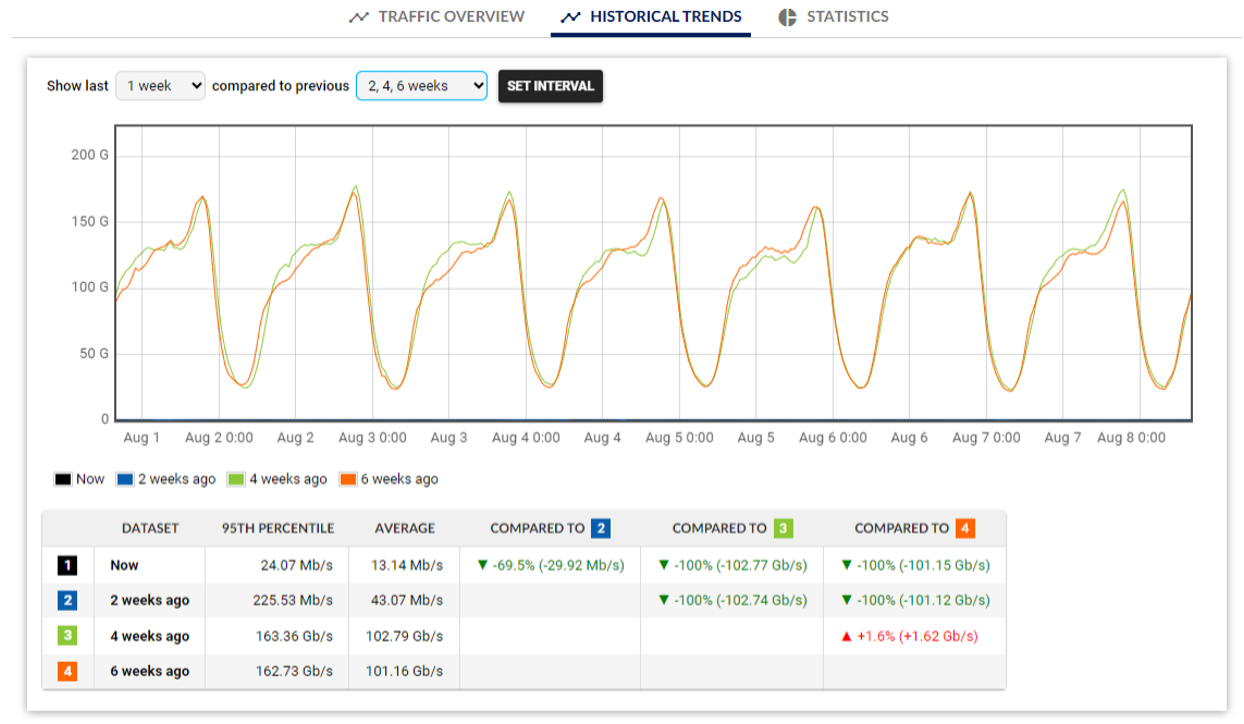
If you want to know more about how your network traffic has changed over time, check out the "Historical Trends" tab in your profile's details. There, you can see your current traffic along with three other customisable timeframes from the past that you can compare. In the summary table, you'll find average values for each time period and the differences between them. These tools help you easily spot any unusual activities or trends that might be happening in your environment.
Finally the same view can be added as a widget to your dashboard. Here you can customise the view even further, setting which channels should be included in the comparison, and also selecting which volumetric data you want to see (packets, flows, bytes).