Until recently, infrastructure and network monitoring were seen as rivals, but today they are rather viewed as complementary technologies. Seek proof with Gartner - they used to be pitted against each other in the Magic Quadrant, but that has now been replaced by the Market Guide, which explains the differences and strong points but does not compare.
Enablement by collaboration
Infrastructure monitoring is a must-have to tackle availability and bandwidth issues and to observe trends of network usage and its elements. Flow-based network monitoring is then a natural step towards understanding user experience or investigating and optimizing the digital environment in greater detail.
By integrating PRTG and Flowmon, you can:
- Understand security and operational issues in a clearer context
- Prioritize issues more easily
- Reduce information noise with integrated reporting
- Monitor the availability of Flowmon appliances
Two perspectives
Paessler’s PRTG monitors your whole company infrastructure, complete with all its systems, devices, traffic, and applications. It is the perfect tool to ensure the availability of all your assets.
Meanwhile, Flowmon ADS combines deep network traffic analysis with a multitude of other methods to detect anomalous behaviors that indicate data breaches, ransomware infections, etc.
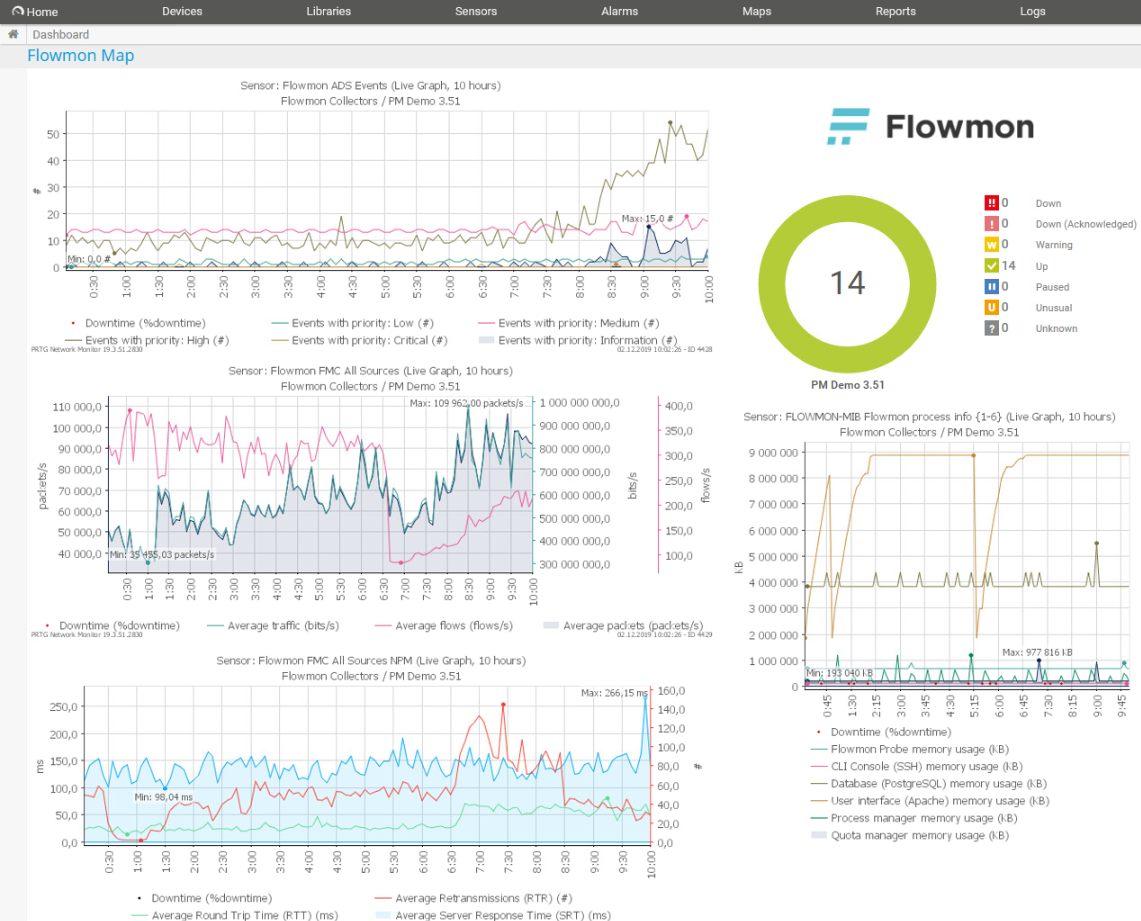
You can use an integration package available on the Flowmon Portal to bring in events detected by Flowmon ADS into PRTG’s user interface and add security awareness to operational status monitoring.
Fig. 1 Flowmon map in PRTG
Centralize two points of view
It takes several perspectives to create an accurate picture of a network’s status and health, mainly due to the progressing decentralization of digital environments and the growing plurality of devices connected to them. The integration of PRTG and Flowmon is a practical way to centralize and normalize disparate points of view into one.
For illustration, consider this example. One server is showing high CPU usage. Flowmon ADS detects this activity as cryptocurrency mining, which is a clear explanation for the increase in resource consumption. And vice versa, the high CPU usage justifies that the detection is valid. In more general terms, the knowledge of the infrastructure’s security status, in addition to availability, provides more ground for the reliable prioritization of diverse risks.
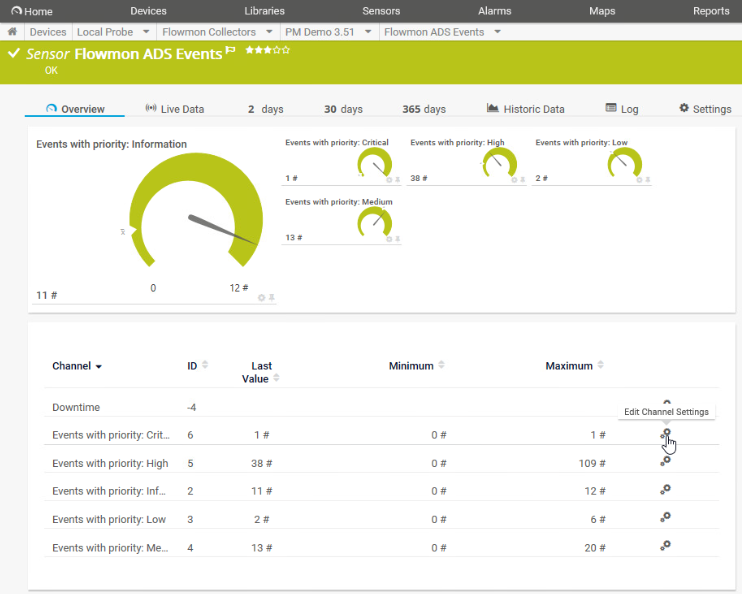
Fig. 2 Security overview from Flowmon ADS in PRTG
PRTG also monitors the availability of all Flowmon appliances deployed in the network (together with every other device), providing a cohesive overview of your whole infrastructure.
One source of information
The integration also makes sense in terms of alerting. When Flowmon detects a problem, it communicates this to PRTG, which will alert you using one of its twelve types of notification (email, syslog, Slack, Microsoft Teams, to name but a few). This means you keep information noise down by drawing on one communication channel, but with the information value of two. In cases where you need to know the root cause, you can always switch to Flowmon and dig deeper.
Network performance
The collaboration extends to network performance as well. By integrating statistics from Flowmon Monitoring Center, you can add the network perspective to your system status monitoring and have a deeper understanding of the condition of your whole IT.
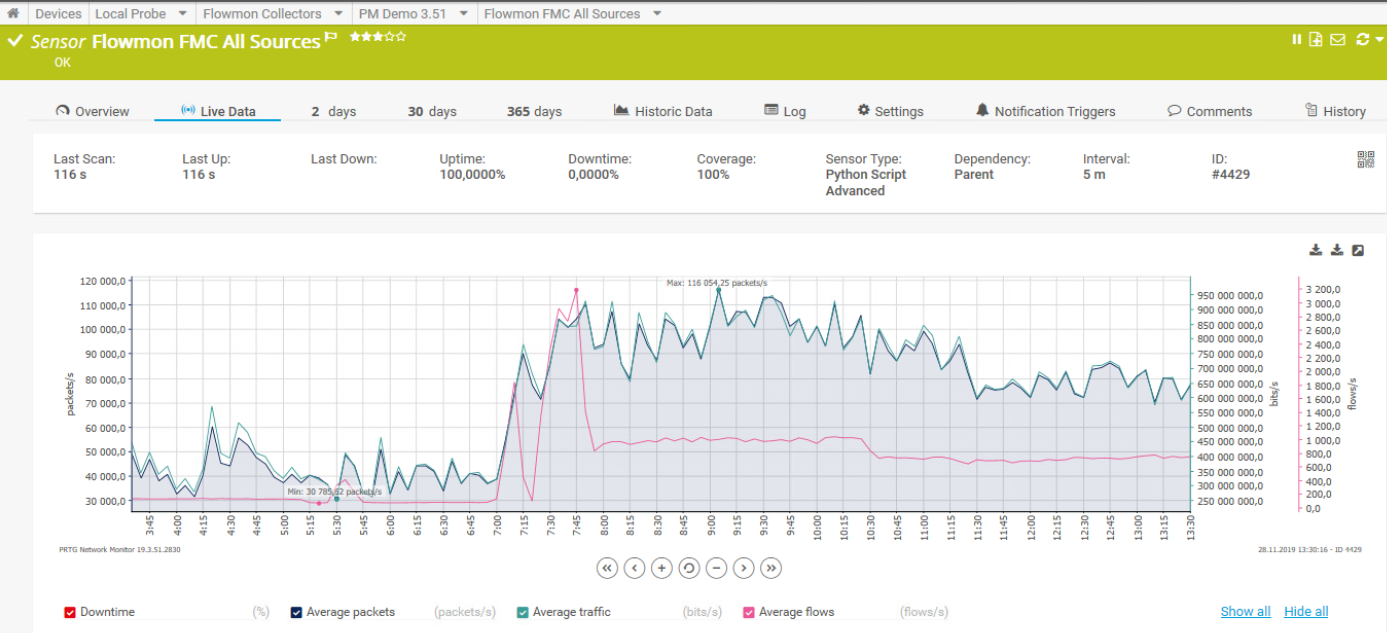
Fig. 3 Network performance statistics from Flowmon Monitoring Center
The integration of Paessler’s PRTG and Flowmon allows their complementary functionalities to work together and provide comprehensive information on your network’s system and security status, enabling an instant yet thorough understanding of emergent issues and prompt response.
Flexibility
The two solutions communicate by REST API (as well as other means), allowing advanced users to create their own integration scenarios that better suit their conditions. PRTG’s Map Designer offers options to display different sources of information in different ways (e.g., live graphs, status donuts, and others).