What Is a Hybrid Cloud Environment?
A hybrid cloud environment refers to an IT architecture that combines at least one cloud service and on-premise resources running in company-owned infrastructure (no matter if in-house, at a co-owned location, or third-party datacenter). For instance, an organization may operate a core ERP system on-site with disaster recovery in the AWS cloud and back-office systems (email, Office 365, HR system) consumed as SaaS.So, you may ask, is network monitoring in the cloud still necessary? Definitely yes. Although third-party SLAs make a promise of performance, IT operations teams will still be held accountable for the quality and performance of services and apps. And you don’t want to find yourself without evidence when a critical customer or employee system malfunctions and the provider denies all responsibility. Visibility gaps ultimately lead to an inability to monitor service quality.
Challenges of Hybrid Cloud Monitoring
Hybrid infrastructures add another level of complexity to delivering a smooth user experience - a bottom-line prerequisite of every successful modern application. There is quite a lot you can observe across the environment:
flow logs in cloud (ie. Amazon VPC Flow Logs)
- network packets (see Inside Data: Full Packet Capture Analysis whitepaper)
- device logs,
- SNMP, WMI,
- agents and APIs,
- synthetic tests.
Thanks to the mixture of owned and rented infrastructure, there are many potential points of failure in application delivery, but in general, you will come across two major challenges.
Decentralized Ownership Creates Visibility Gaps
The diversity of providers, responsible departments, and tools along the service delivery chain may create visibility gaps. You can collect application performance data, infrastructure data, network data, etc., but when everything is spread across different environments and tools, it makes it harder to find out where the problem is and troubleshoot quickly.
Siloed Monitoring Strategies Affect MTTR
With cloud you can’t simply add another data source to your monitoring system; you need to enhance your monitoring strategy with new capabilities. Basically there are these monitoring options:
- Use a cloud vendor’s native monitoring tools (see Google Cloud's operations suite, Amazon CloudWatch, Azure Monitor).
- Use the cloud provider’s native vTAP to mirror traffic into your monitoring appliance (see Amazon VPC Traffic Mirroring, Google Packet Mirroring).
Use third-party vTAP (if available for the given environment).
Use flow logs (if the cloud platform allows their export).
Use a specialized agent-based solution (New Relic, AppDynamics) .
The problem is that when you apply different monitoring strategies, you may create islands of insight and miss the “big picture”.
What it Takes to Monitor a Hybrid Cloud Environment
Hybrid cloud monitoring should help you identify emerging defects and alarming patterns so you can prevent minor issues from turning into significant problems.In the traditional setup, NetOps leaders have clear visibility across the IT environment, from servers and network stack to applications. You must be capable of the same in hybrid:
- Application troubleshooting, capacity planning, SLA, and UX monitoring.
- Differentiate and resolve problems in the network, web, application, and database.
- Ideally run solutions which have no impact on the performance of the application, UX, and are within budget.
A lightweight hybrid cloud performance monitoring tool?
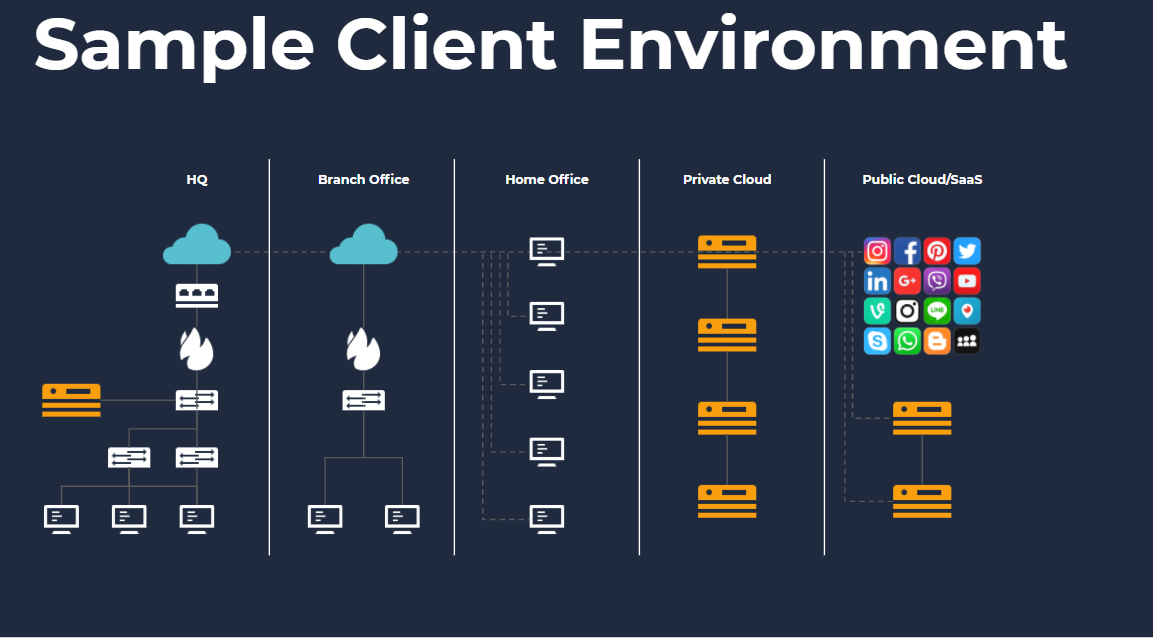
So is there a lightweight approach that covers all important use cases from a single dashboard? Take a look at Figure 1 below, which shows a simple hybrid cloud environment.
Figure 1 A simple hybrid deployment comprising on-premise assets, private cloud, SaaS applications from the public cloud, and remote workers.
Here in Flowmon, we develop a mature solution that goes far beyond traditional on-premise monitoring, providing a full-fledged cloud performance monitoring tool to analyze cloud traffic and troubleshoot anywhere along the application delivery chain. In essence, it stands on three pillars:
- With network performance metrics you can measure the performance of a broad spectrum of services and applications delivered over the networks.
- With application performance monitoring you can drill down into transaction-layer information, and thus troubleshoot application errors and measure latency for any user and any transaction.
- With synthetic testing for SaaS applications, such as Office365, you can monitor their availability and overall responsiveness and understand network delay.
Flowmon deploys sensors on-premise and in both private and public cloud. Thanks to its ability to process diverse sources of data, it can leverage flow logs, native cloud traffic mirroring, and vTAPs from multiple third-party vendors, which it then normalizes and provides full detail about every user transaction centrally.In other words, it gives you a consolidated view of all the different environments with the same level of detail and the same metrics available.
Maximizing Performance and Availability across Hybrid Cloud
It’s a sad but common sight that hybrid cloud users in the enterprise segment several different tools to meet their monitoring needs.But to truly benefit from the scalability and flexibility of the cloud, you not only need a satisfactory level of insight to troubleshoot confidently, but also to fuse all the islands of insight together and achieve true cross-environment visibility.If you want to learn more, check this webinar on Powering Digitalization with End-User Monitoring.