You are familiar with Progress Flowmon as a monitoring system providing visibility into network traffic, incidents, application performance, and other network-related issues. As such, it is a good practice to monitor your Flowmon appliances to make sure they are running fine and without any issues like any other IT system or server you operate. In this blog post, I will share my experience that I gathered over the past years and show you a few examples.
Why monitor Flowmon?
It can help you to spot hardware failures or system resource problems. Overall, there are four different ways to achieve that, each with a different level of complexity and different level of detail.
Generic SNMP and syslog monitoring
The first two are using built-in standard Linux-based SNMP monitoring and syslog messages.
These alone can already provide very valuable insight, and there are many free or commercial monitoring and log collection tools you can choose from. This is how I once found a failing SSD drive in our Flowmon demo server located in US because it allowed me to see increasing disk waiting times in Zabbix.
Figure 1 – Historical charts of average disk waiting times shown in Zabbix
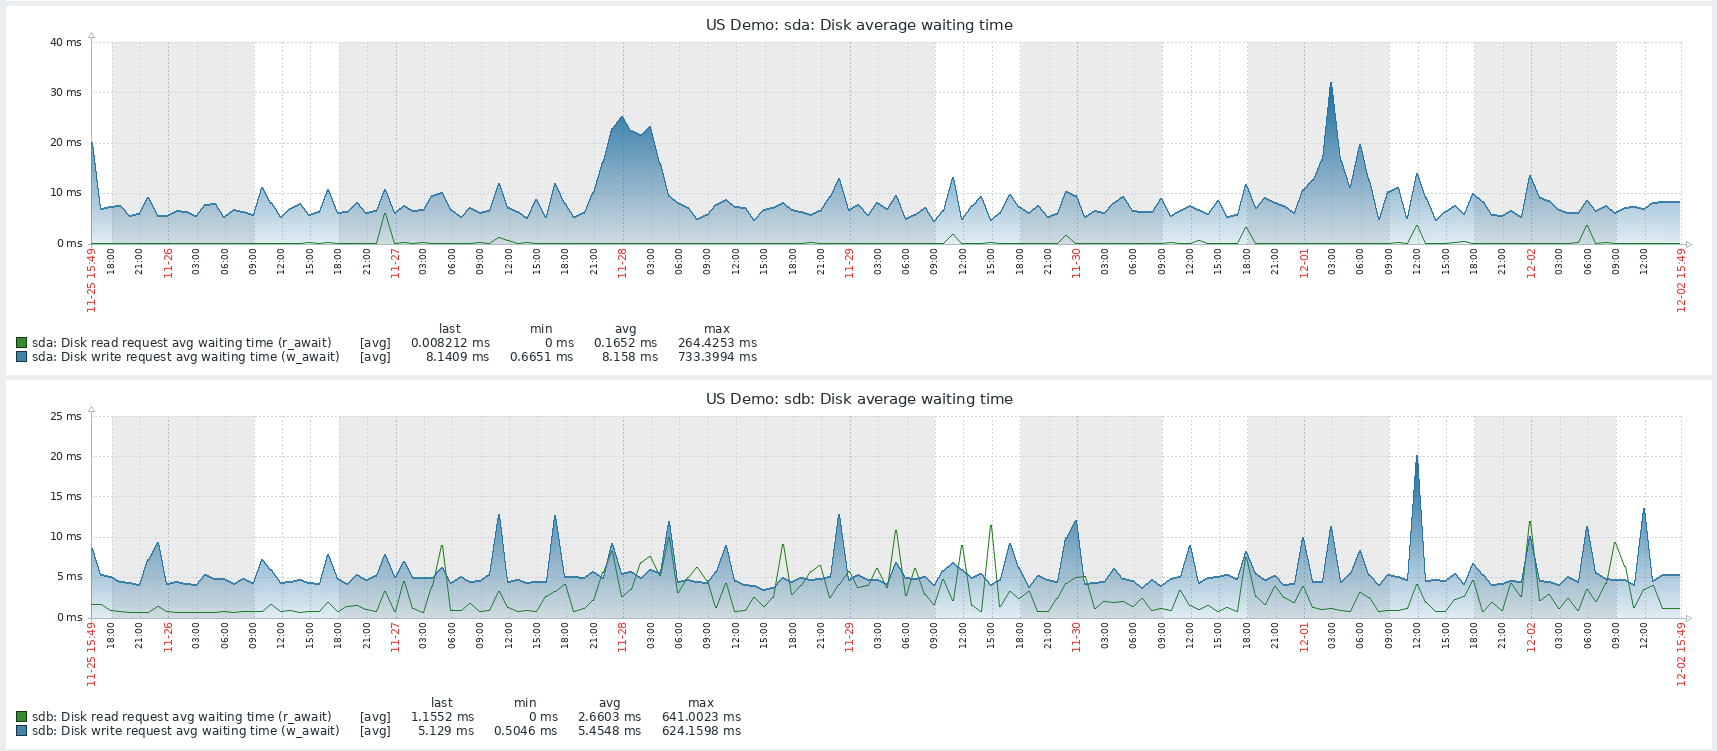
Being able to see the history shows you what has changed over time and even allows you to receive alerts when a particular value is too high. This way you’ll learn about any hardware-related problems and can also monitor certain processes or analyze syslog to see system failures. This is described in more detail in Flowmon documentation or any standard Linux server operation you are probably utilizing already.
More granular monitoring specific to Flowmon
The next two methods are more complex, but they also bring you much more insight. I’m going to focus on them in closer detail.
The first method relies on Flowmon-specific MIB to monitor the Flowmon appliance. A great tool for infrastructure monitoring is WhatsUp Gold, which can monitor Flowmon appliances and provide not just generic Linux-based metrics from the system but also status and performance metrics of individual Flowmon-specific components.
Figure 2 – Monitoring charts and statistics for the Flowmon system in WhatsUp Gold
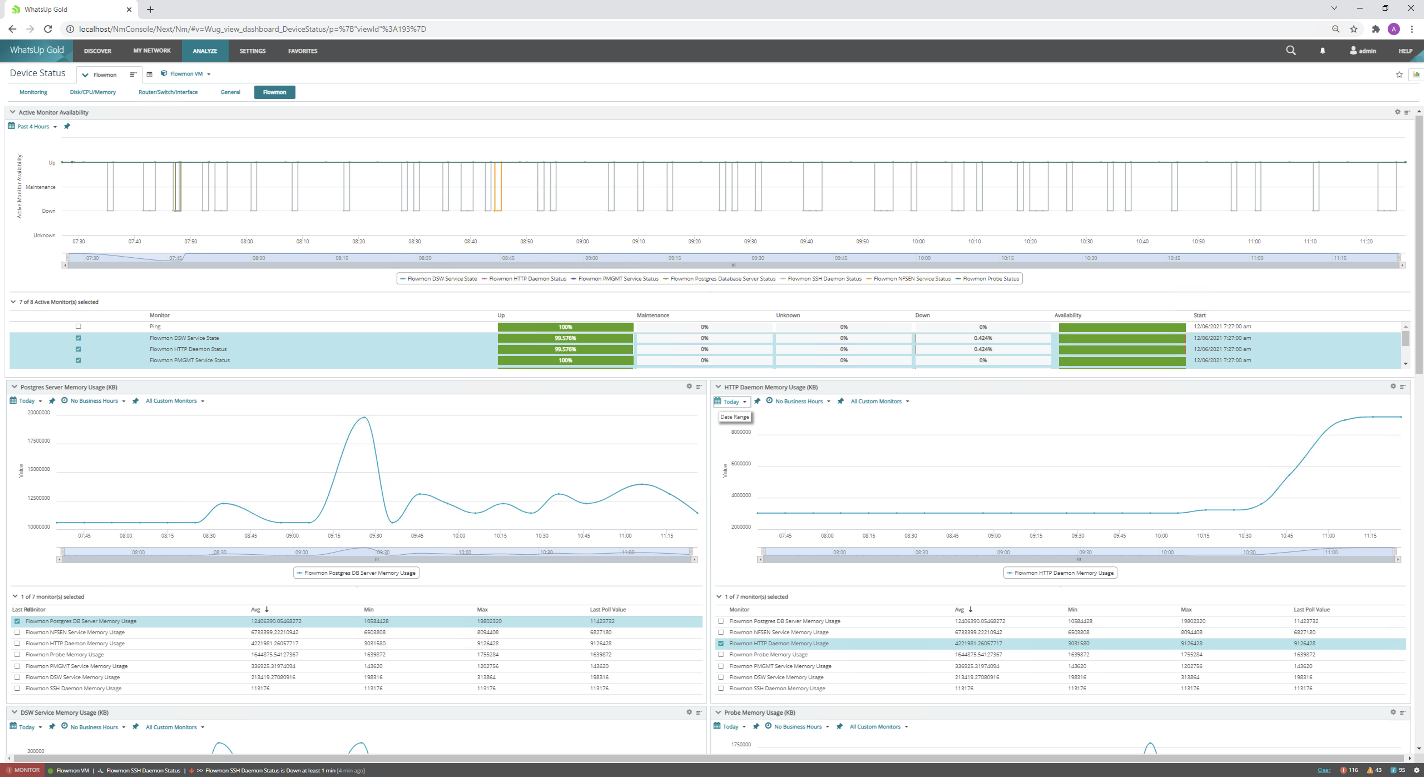
The Flowmon SNMP MIB is available on our portal. If you would like to implement this using another system, below are the processes you should monitor:
- sshd – SSH service to access appliance CLI
- httpd – web server running UI
- postgresql – database used for the UI, configuration and reporting
- pmgmt – process manager that should ensure all Flowmon critical processes are running
Then there are some which are relevant only for flow collection and processing:
- nfsen – the flow collecting process
- dsw – responsible for profile quotas
When you run ADS on your Collector:
- ads-preprocessing – flow preprocessing
- ads-stream – stream processing engine for detection methods
- ads-bpattern-engine – engine running Behavior patterns method processing
- ads-psql – responsible for events input into database
On a Probe device, there is only one additional process to monitor flowmon (flowmonexp5) – the probe startup script or the exporter itself.
The second method is to create a custom script collecting all the additional metrics you are interested in using a custom format, which is then processed by a tool like Grafana or any other system you might be using. I have used this recently at one of our customer deployments; it involves a monitoring agent running on your Flowmon appliance as a docker container with extended metrics for our system to provide insight.
In this example I used a node-exporter, which is a great solution to provide standard system metrics like CPU, disk, and memory usage as well as network interface status and utilization. The level of detail you get depends on your configuration and choice of metrics.
I have extended this with a script which provides additional metrics describing the activity of the Flowmon Collector:
- nfcapd_flows - Number of flows received by the Collector
- ads_events - Number of events in five minutes
- ads_fps - Number of flows processed in five minutes
- live_lifetime - Number of days kept in live profile
- profiles - Number of profiles created on the Collector
- channels - Number of channels created on the Collector
These metrics will help you to track the number of flows each Collector is processing so that you may intervene if this number drops. You can also see the length of full flow data history and the number of configuration objects to know if the system is not overloaded or if there is a relation between CPU usage and an increase in one of the metrics.
As for Flowmon Probes, you can monitor metrics indicating what is processed by the exporter itself and if it is in line with information from the network card. In this example the customer is using our 100G Probe modes, so I have added the network card statistics as they are not available at the standard system statistics. The packets processed by exporter and received on interface should corelate. If exporter process less, then it might not be running well.
- flowmonexp_flows - Number of flows created by the exporter
- flowmonexp_bytes - Number of bytes processed by the exporter
- flowmonexp_packets - Number of packets processed by the exporter
- flowmonexp_collisions Number of flow cache collisions, this metric should ideally be 0 but less than a thousand per second.
- int1_packets - Number of packets processed by the first port
- int1_drops - Number of packets dropped by the first monitoring port
- int2_packets - Number of packets processed by the second monitoring port
- int2_drops - Number of packets dropped by the second monitoring port
These are then served by a node-exporter text file the Collector which has been started in docker by the command:
sudo docker run -d \
--net="host" \
--pid="host" \
-v "/:/host:ro,rslave" \
-v "/home/flowmon/perfmon/:/var/lib/node_exporter/textfile_collector:ro,rslave" \
quay.io/prometheus/node-exporter:latest \
--path.rootfs=/host \
--collector.textfile.directory=/var/lib/node_exporter/textfile_collector
This is how I extended the standard available metrics. You can find the script providing additional metrics here.
Using your metrics
All this will ensure that your Flowmon devices are running at good health. Once implemented in Grafana, for example, you will see nice statistics and receive an alert when a certain value is off.
Figure 3 – Granular Flowmon statistics displayed in Grafana
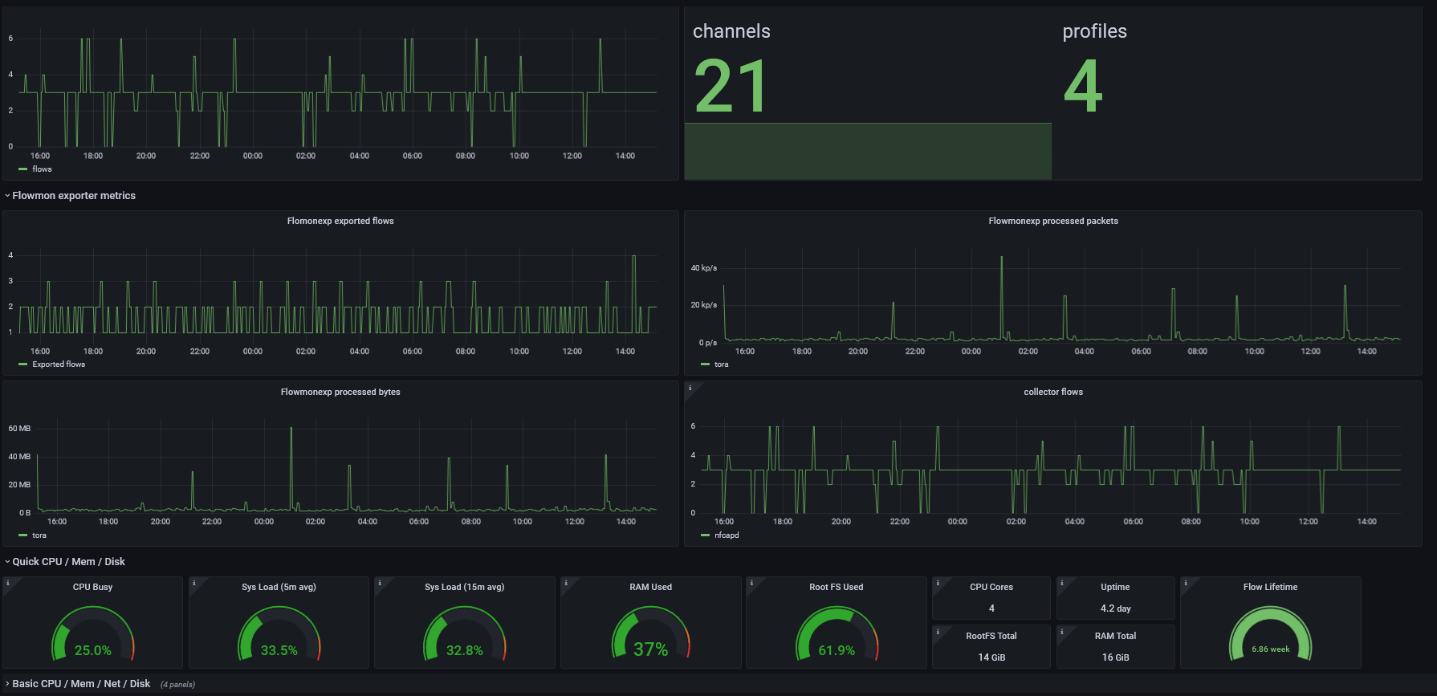
Of course, with some metrics it’s easy to tell whether the value is good or bad, like in the case of disk usage, memory, and lifetime. These should also depend on your usage – with the CPU, memory, and disk usage above 85% triggering an alert. This is because a CPU or memory load above 85% may degrade the user experience.
But some network metrics like errors will always be inevitable and so a low number of them is going to be normal. Usually, you should be able to set them up accurately after you’ve observed your system for some time and know what normal behavior looks like.