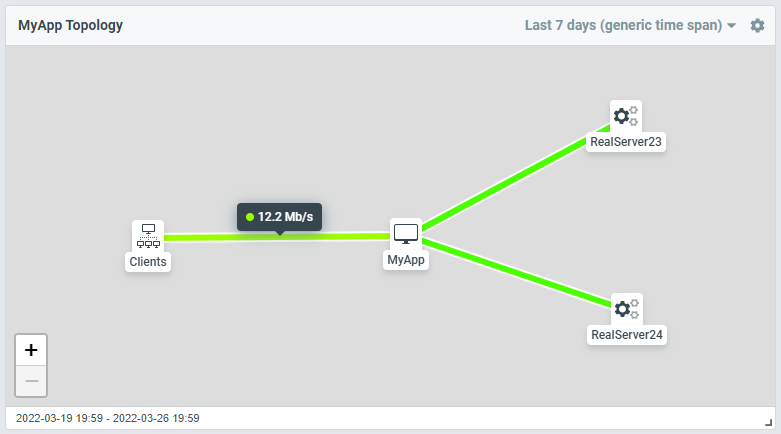
Let's take a look at how Progress products can help achieve this with a simple example. We have an internal application MyApp that is delivered through LoadMaster to achieve scalability, redundancy, high availability and another layer of protection. The application is hosted on a pair of servers, RealServer23 and RealServer24. This is a very common situation for enterprise-grade applications. The overall application topology is visualized in figure 1.
Figure 1: MyApp topology as represented by Flowmon using topology maps.
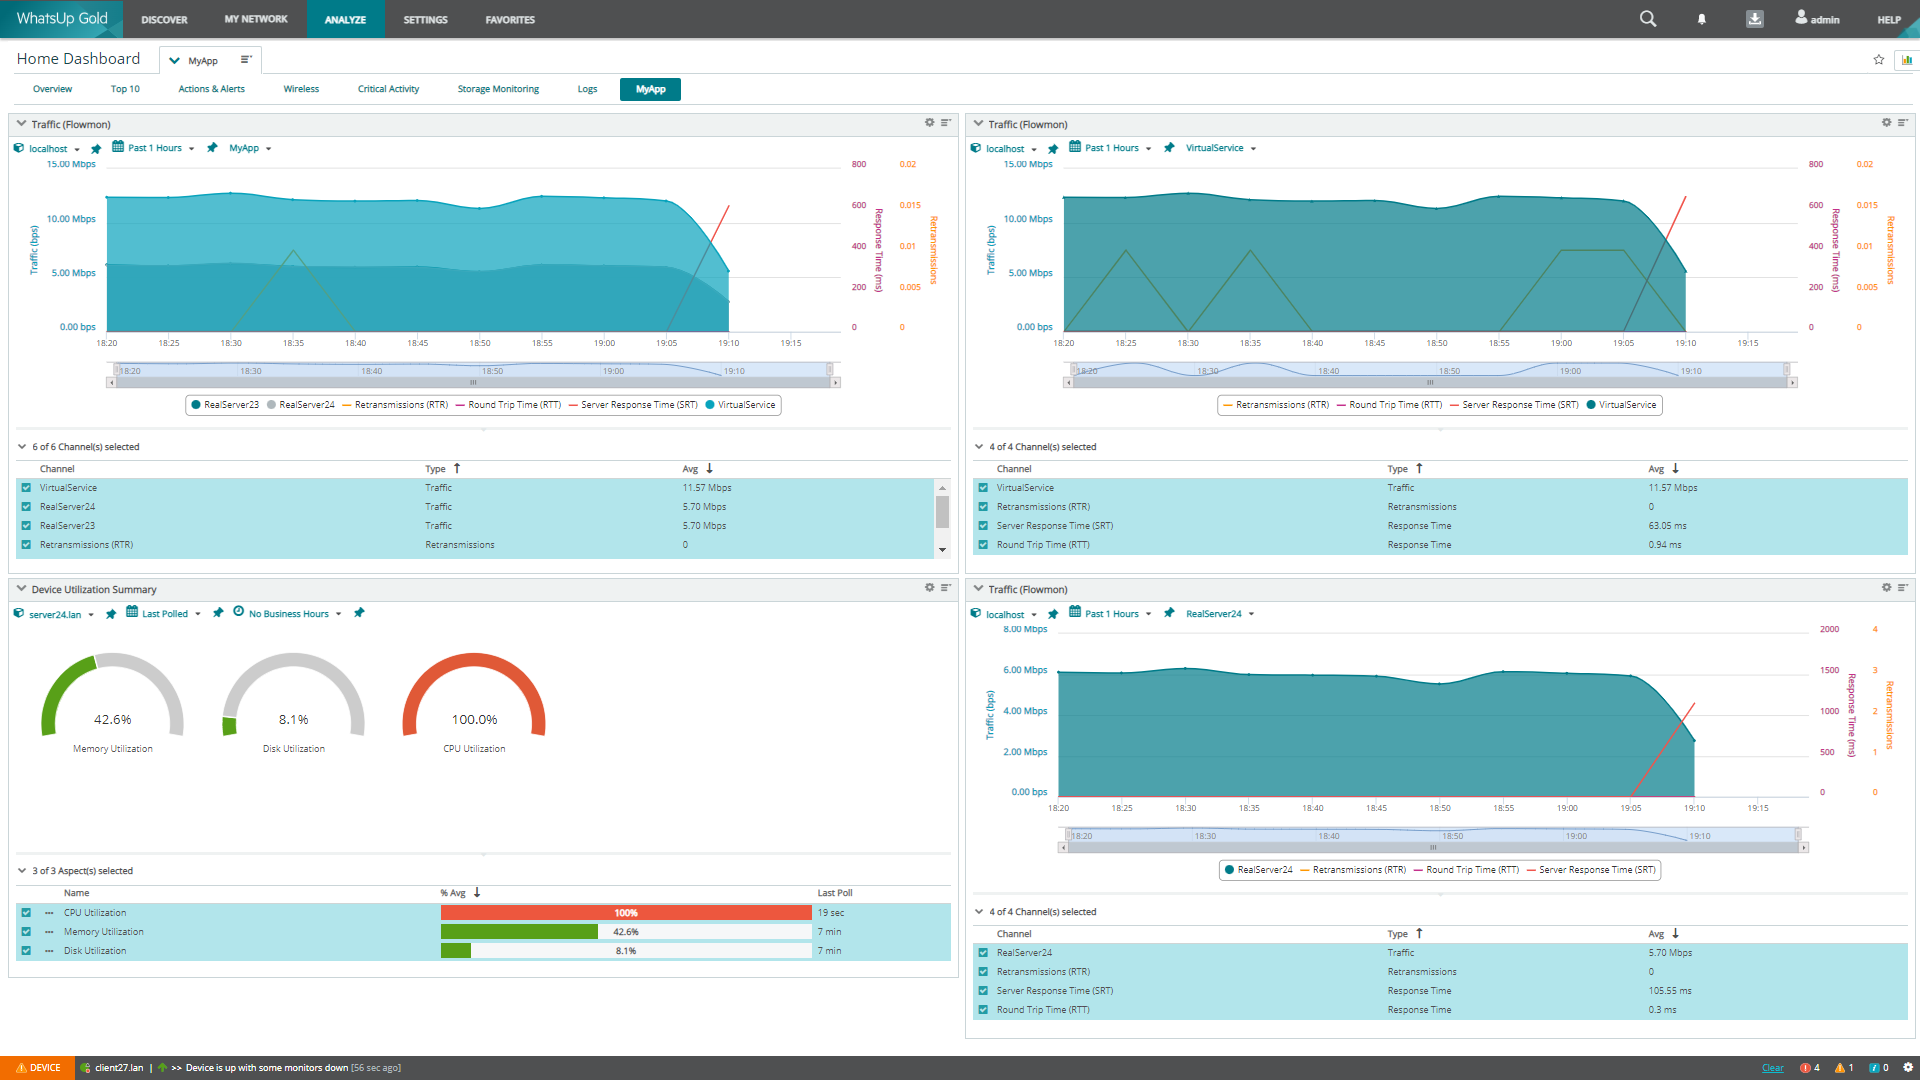
Let's start with the overall dashboard for MyApp in Whats Up Gold (figure 2). It connects IT infrastructure monitoring with Network Performance Monitoring & Diagnostics in a single view and gives insight at a glance. At first sight, we notice that server response time is degraded, overall application throughput is affected, and our RealServer24 shows CPU overload, which is correlated with server response time and throughput degradation on this server. The root cause is obvious, and our conclusion is made in a matter of seconds.
Figure 2: Overall dashboard representing the health of MyApp and individual components of the application delivery chain.
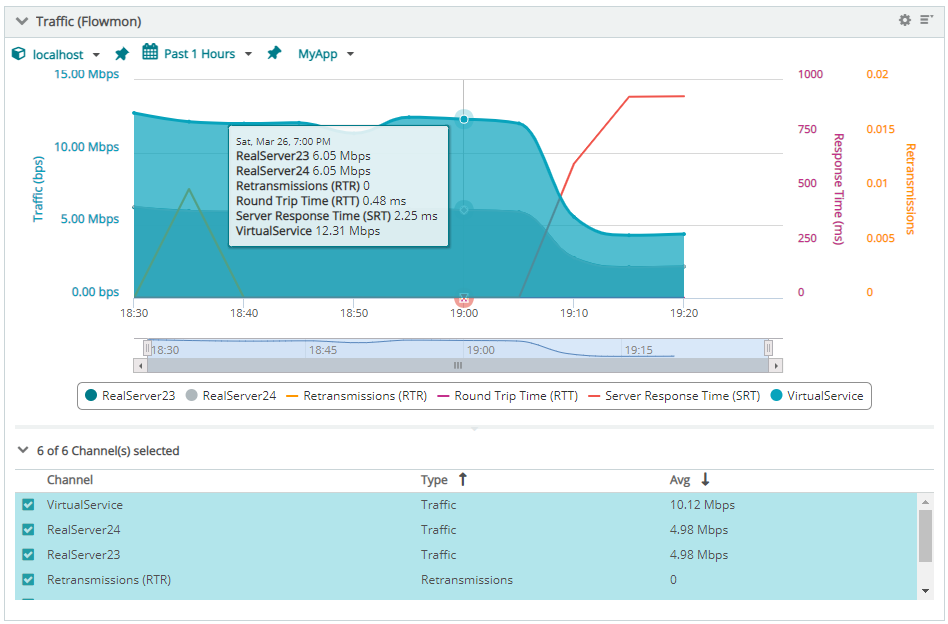
Now let's take some time to break down this dashboard and show how different charts highlight different aspects of the environment to allow us to isolate problems like this quickly. In the traffic overview of MyApp (figure 3), we can see individual components of the application from the network perspective, understand bandwidth utilization and summarize performance metrics such as server response time, round trip time or retransmissions.
Figure 3: Volumetric and performance metrics gathered from Flowmon and displayed on Whats Up Gold dashboard. On this specific screenshot, we understand network traffic between users and load balancer (channel VirtualService) and between load balancer and individual servers (channel RealServer23 and RealServer24). Performance metrics are aggregated for both user-facing traffic and traffic between the load balancer and servers hosting the application. All the metrics at 7 p.m. are still in normal ranges.
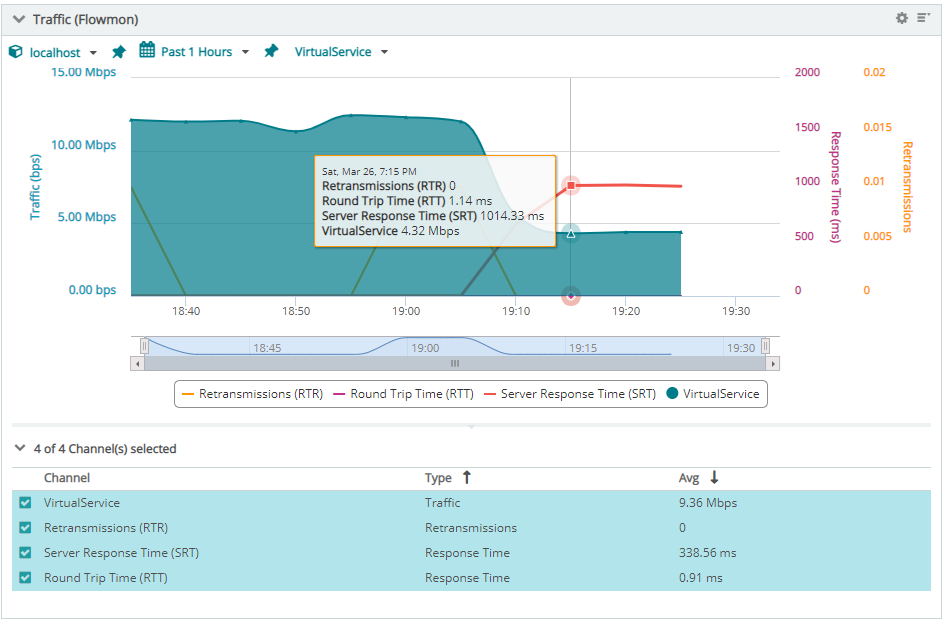
In the traffic overview of VirtualService (figure 4), we understand bandwidth utilization and individual performance metrics as experienced by users.
Figure 4: Volumetric and performance metrics gathered from Flowmon and displayed on Whats Up Gold dashboard. On this specific screenshot, we understand network traffic between users and load balancer (channel VirtualService), which corresponds to real user experience with the application. Metrics at 7:15 p.m. are already affected, showing throughput degradation and a substantial increase in server response time while round trip time is not affected. Therefore the issue is not the network as such and is related to application or server infrastructure.
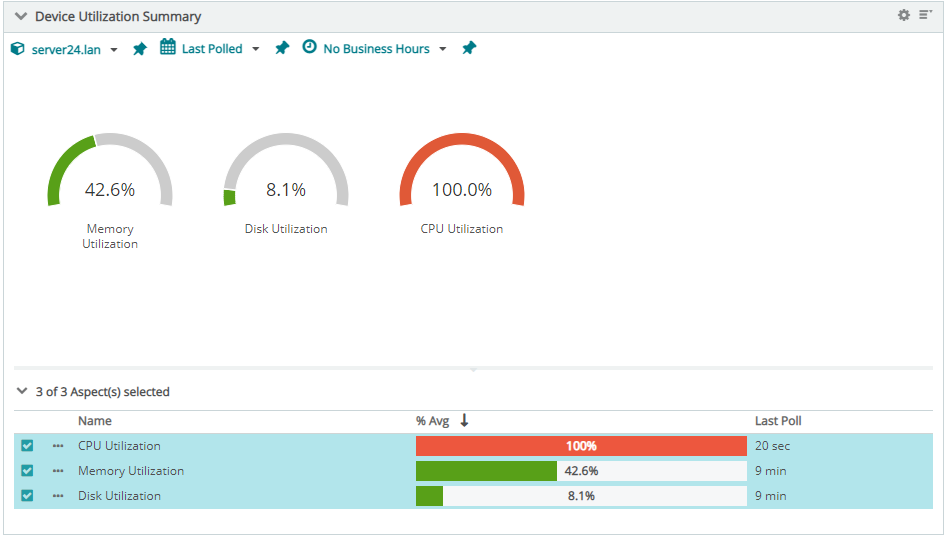
Next, our concern is the status of individual components down the line. Monitoring of system resources on RealServer24 shows CPU overload (figure 5).
Figure 5: Device utilization summary as a native Whats Up Gold functionality. Metrics on this specific screenshot clearly show that the CPU of RealServer24 is utilized at the level of 100%; therefore server lacks the resource to handle user requests properly.
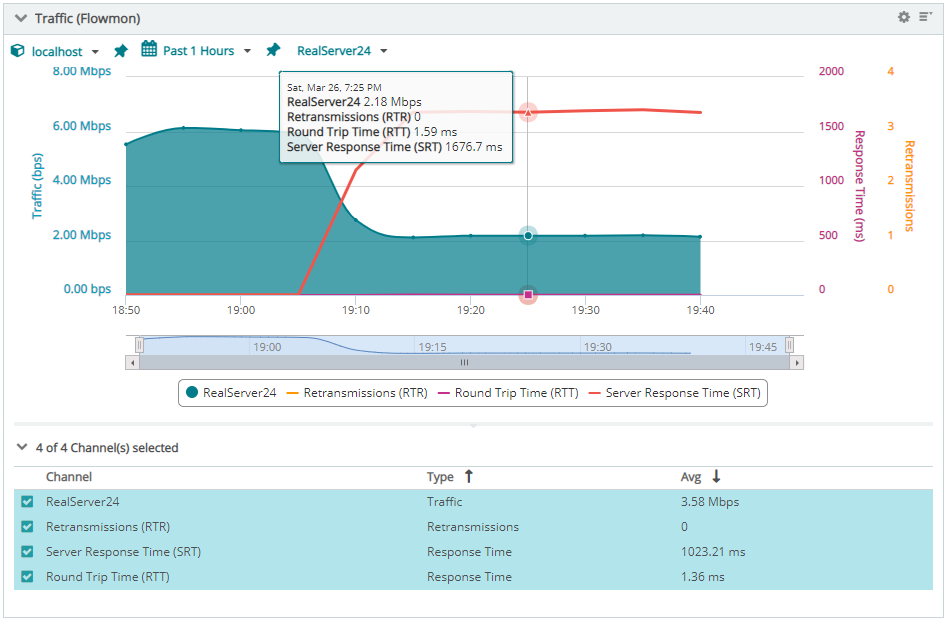
This CPU overload has a clear impact on user requests steered to RealServer24. Flowmon can further quantify this impact, and a consolidated picture is again available in Whats Up Gold next to the device utilization summary (figure 6).
Figure 6: Volumetric and performance metrics gathered from Flowmon around RealServer24 and displayed on Whats Up Gold dashboard. Metrics at 7:25 p.m. show throughput degradation and a substantial increase in server response time to more than 1.6 seconds. This is the impact of an overloaded server on the user experience.
We have demonstrated how integrated IT infrastructure monitoring and Network Performance Monitoring & Diagnostics can provide a consolidated view of all relevant metrics and telemetry to connect the dots and help to discover the root cause of application experience issues.
Here at Progress, we are on a mission to redefine Application eXperience and provide IT professionals with tools that will give them back control of the whole digital environment. The presented capability is based on the Whats Up Gold version 2022.0 that provides out of the box integration with Flowmon to gather and present volumetric and performance metrics as well as security events using Flowmon's native REST API and is available to all Whats Up Gold and Flowmon users. Flowmon version 11.1.x or 12.x is required. For security events Flowmon ADS version 11.4.x or 12.x is required.