We’ve revised our Network Performance Metrics Alerting to work even more swiftly, extended support of Cisco performance measurements, tuned overall responsiveness of UI and extended visibility into Industrial IoT communication. In addition, we’re reinforcing our technology leadership in Cloud monitoring by adding AWS FlowLogs digestion support.
News and improvements
Alerting based on network performance
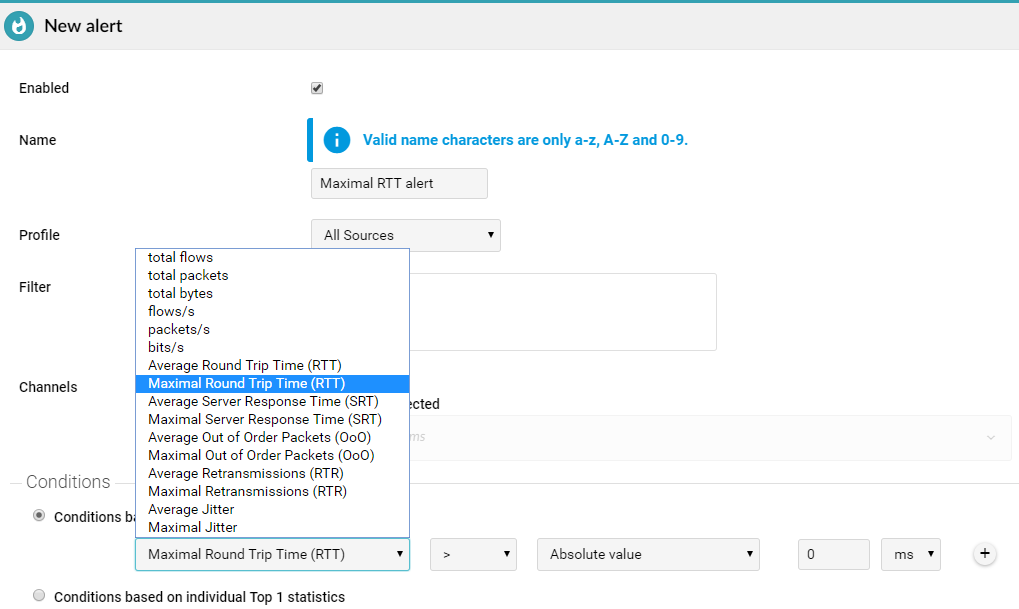
Flowmon newly allows to define alerts based on NPM (Network Performance Monitoring) metrics so, for example, average Round Trip Time, Server Response Time, etc. This way you automatically identify latency degradation of critical services faster than ever.
New NPM conditions
Alerting on 30s profiles
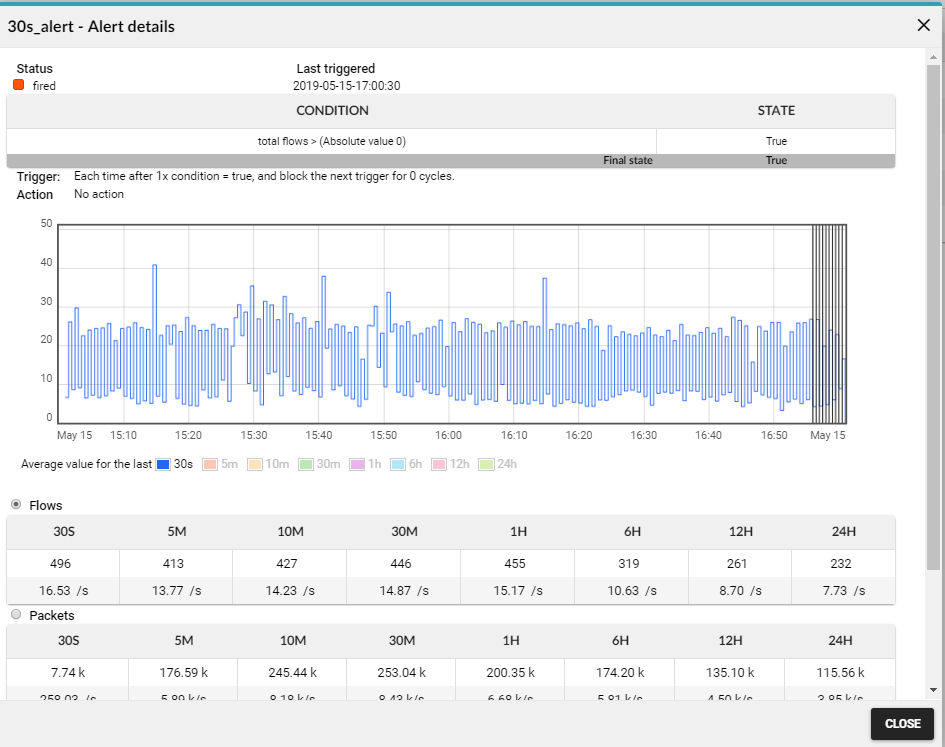
The Alerts defined for 30-second profiles are evaluated every 30 seconds to enable administrators to respond to incidents in a brisk.
Details of Alert for 30s profile
Cisco AVC ART metrics mapping to NPM metrics
We are newly able to process Network Time, Response Time and Art Count Retransmissions values received from Cisco devices supporting AVC. When these values are received they are converted and saved as equivalent proprietary data fields.
- Network Time is mapped to NPM RTT
- Response Time mapped to NPM SRT
- Art Count Retransmissions mapped to NPM TCP Retransmissions
Amazon VPC Flow Logs support
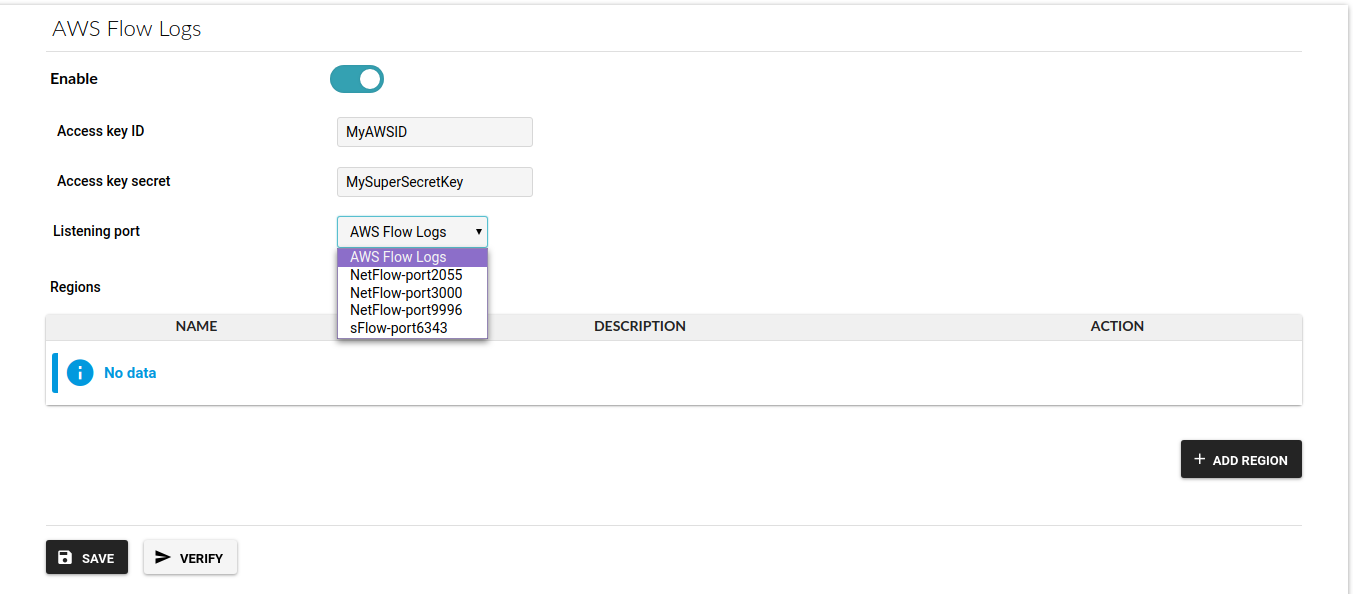
Flowmon 10.2 supports processing Amazon VPC flow logs that allows to natively monitor the Amazon infrastructure. VPC Flow Logs capture information about the IP traffic going to and from network interfaces in Amazon Virtual Private Cloud. The Flow Logs are periodically acquired from Amazon CloudWatch, processed, converted to IPFIX format and subsequently sent to Flowmon Collector to a defined UDP port.
Connection configuration
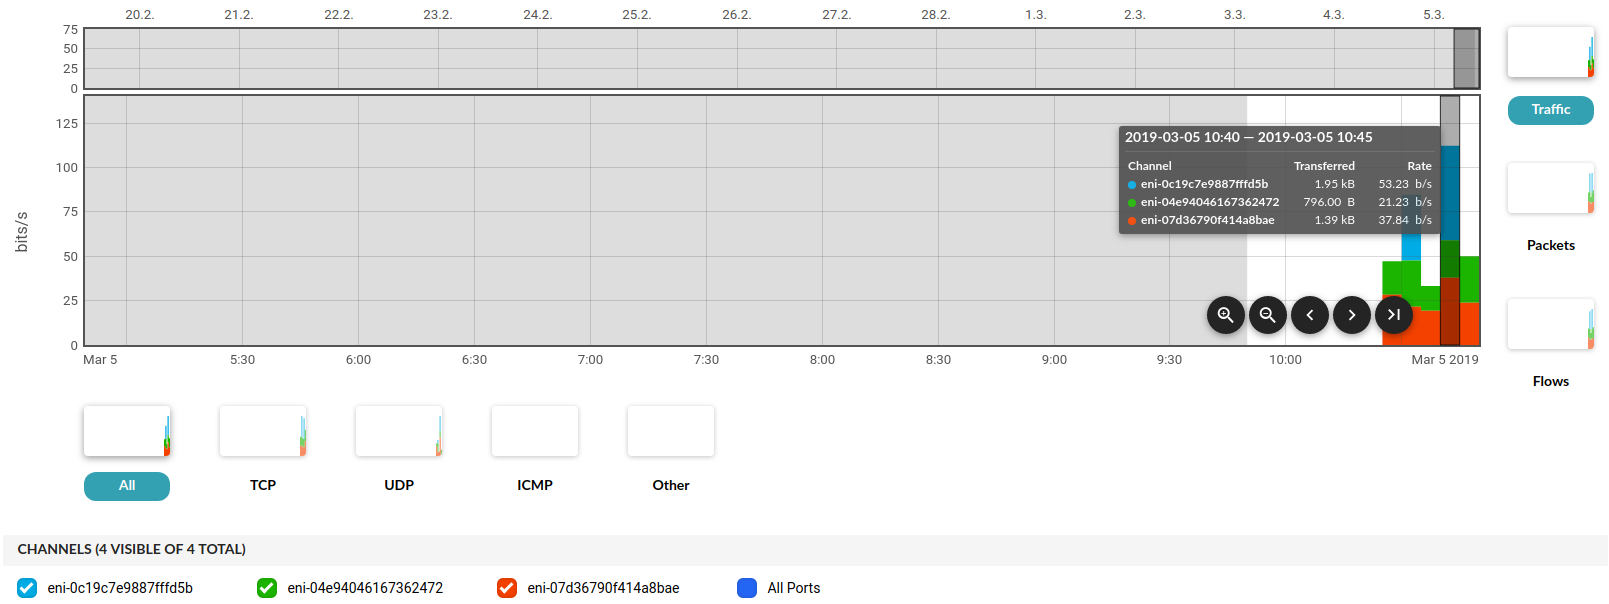
Traffic obtained from Amazon VPC
Extended SCADA/IOT monitoring
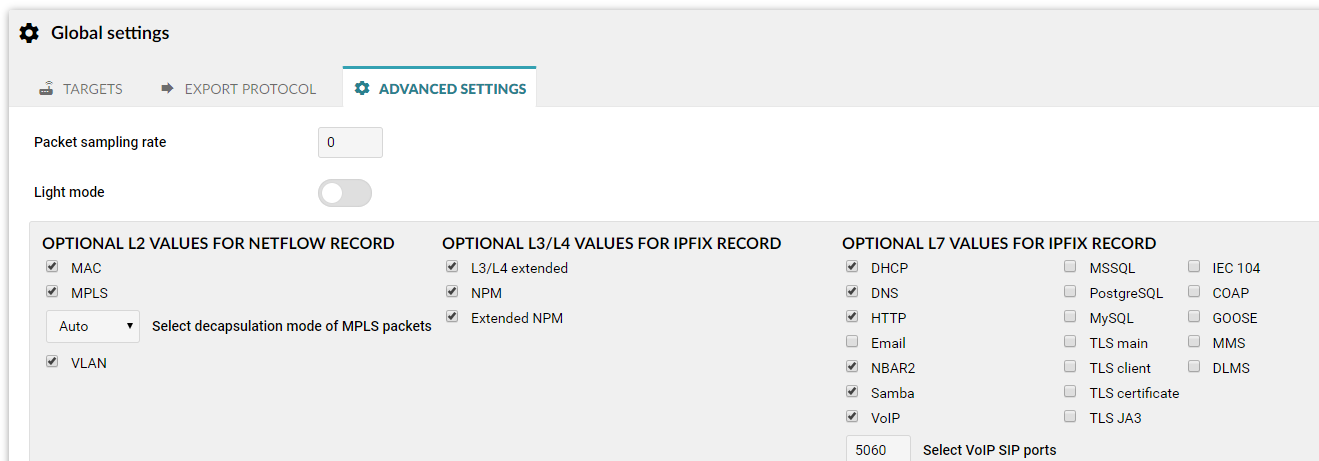
We are further extending our capabilities of SCADA/IOT monitoring. This time we are focusing on energy distribution grids by adding support for monitoring of IEC 61859 (GOOSE/MMS) and DLMS protocols.
Monitoring port settings
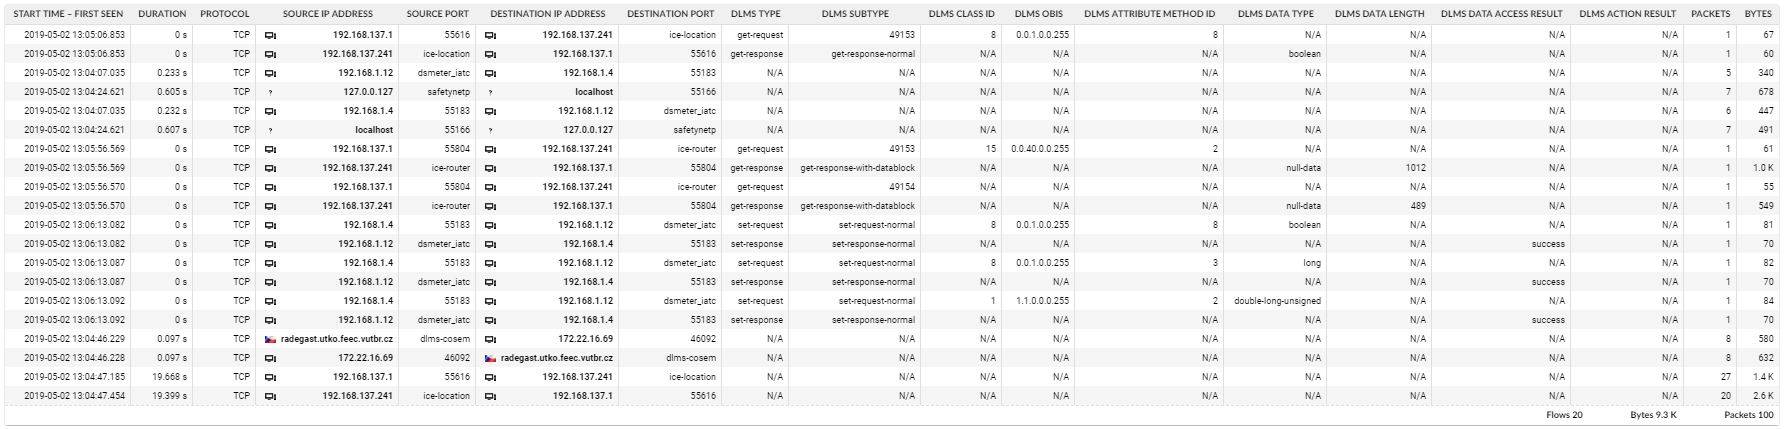
DLMS protocol details
Extended SNMP monitoring of Flowmon appliance
The capability on how to monitor Flowmon via SNMP has been extended by adding new MIB databases: UCD-SNMP-MIB and our own Flowmon-MIB with the following object groups:
- Appliance info - contains basic information about the appliance (contact name, email etc.).
- Status info - contains information such as load, uptime, disk operations etc.
- Quotas info - contains information about plugin and profile quotas Process info - contains information about the state of the running process.
- Memory utilization – contains information about the memory utilization (buffer/cache size etc.).
- Disk utilization - contains information about disk utilization (used/available space etc.).
Detailed list of all supported objects can be found in the document “Flowmon SNMP - Supported Objects” on Flowmon Support Portal. Usage of these databases and objects is described in our blog post “Monitoring Flowmon system resources via SNMP”.
LDAP integration improvements
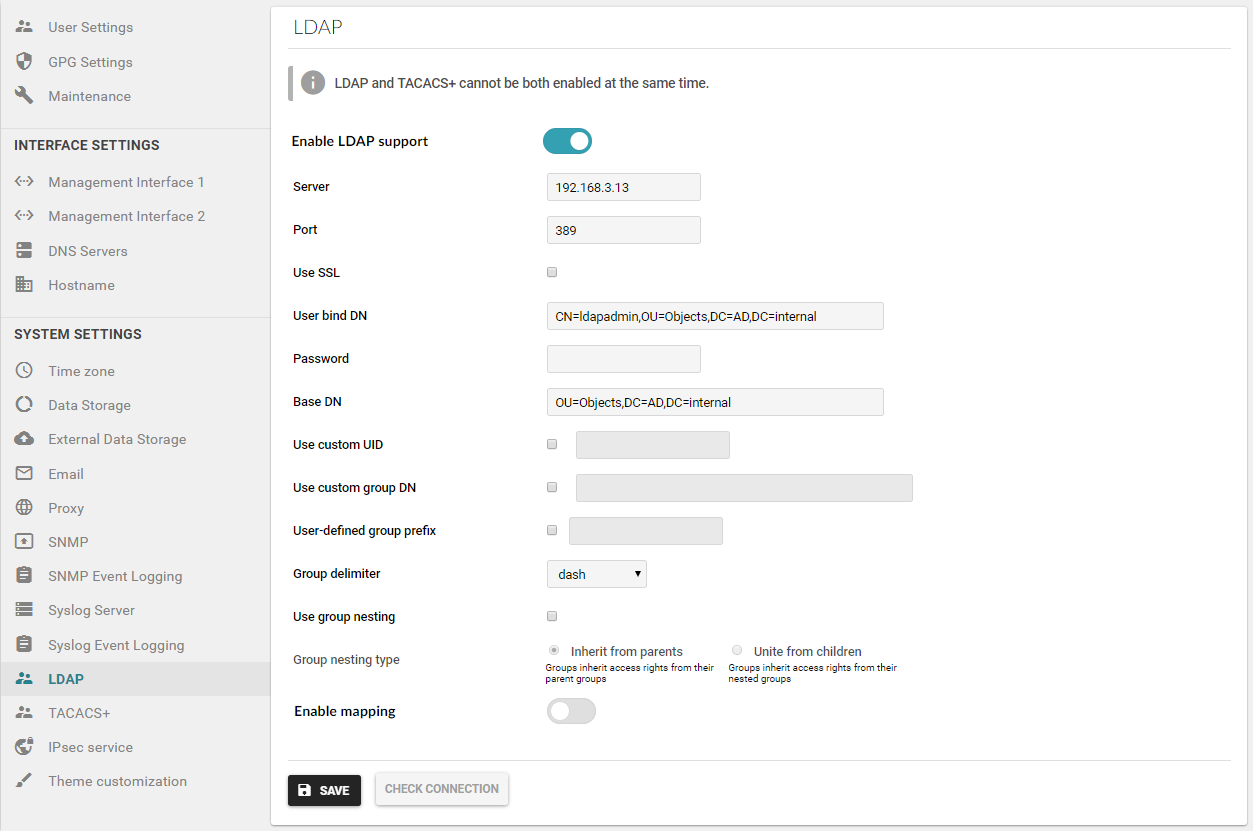
We have reworked the way how Flowmon integrates with LDAP to simplify the administration of roles and access rights. The following changes were made:
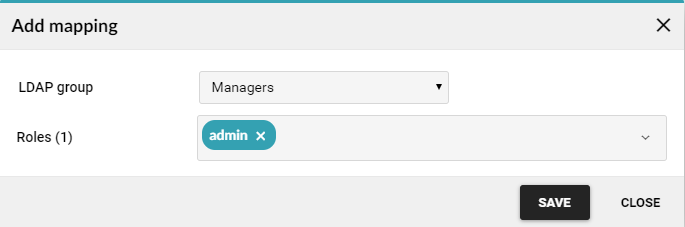
- In the user interface it is possible to directly browse in the LDAP structure and map LDAP groups to Flowmon Roles.
- Support for nested groups has been added. Nested groups support hierarchical relationships used to define inherited group membership.
- It is possible to use two search bases, one for user accounts, second for groups.
- The user ID attribute is configurable.
Updated LDAP configuration screen
Group to role mapping example
Support for FMD Configuration distribution in DA
The dashboard configuration (dashboards, widgets, etc.) is now also distributed to the secondary Master Unit when distributed architecture is enabled.
DA state backup and restore
Support for DA topology import/export allows the administrator to simply backup the Master unit configuration and then restore in case of failure to a replaced Master unit, which can then be connected to the existing DA topology. The Distributed Architecture Overview document was also extended to describe the possible backup and recovery scenarios.
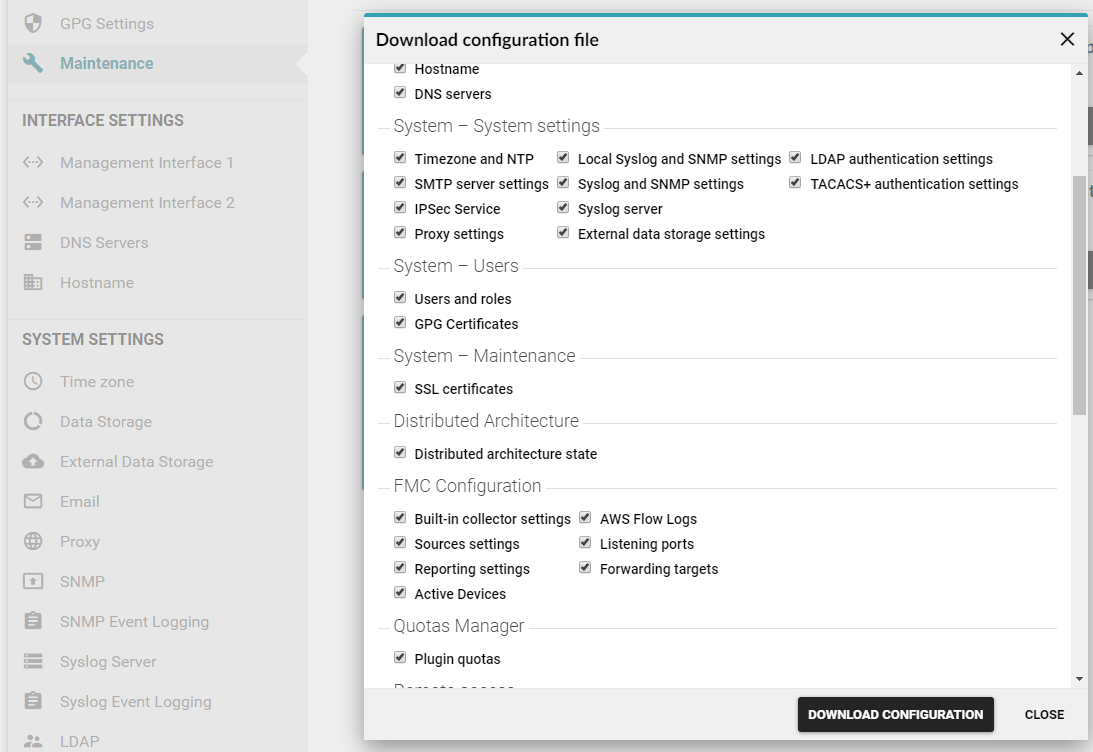
Distributed architecture state as part of the configuration file
Performance optimizations
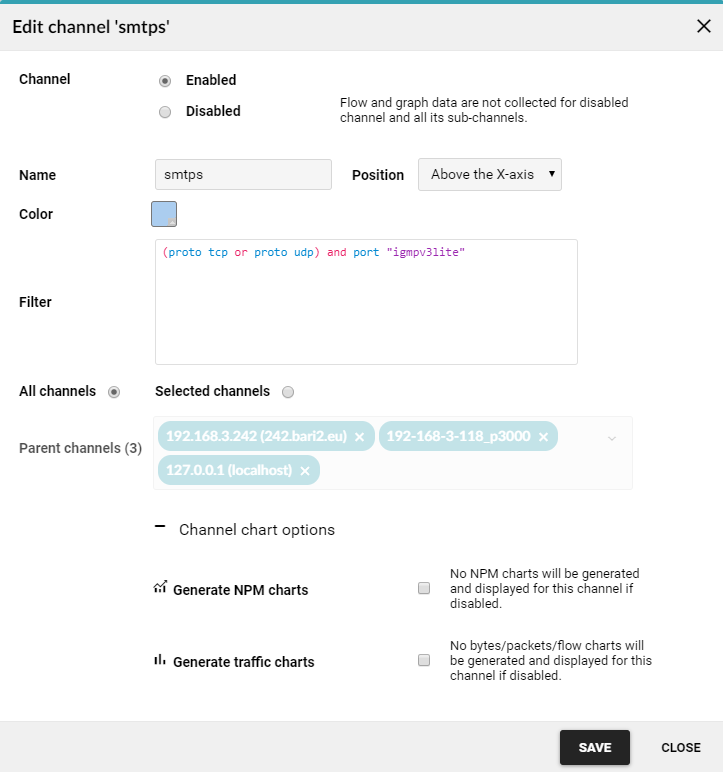
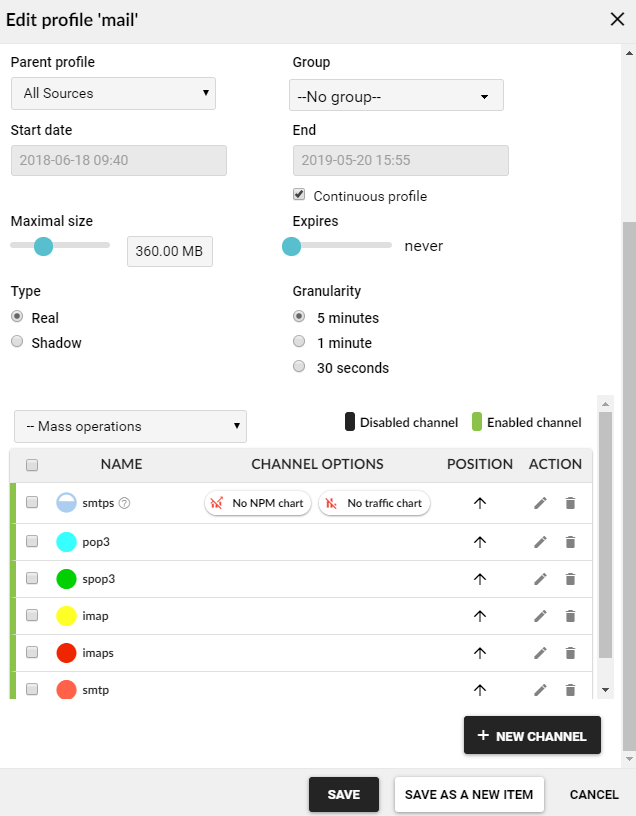
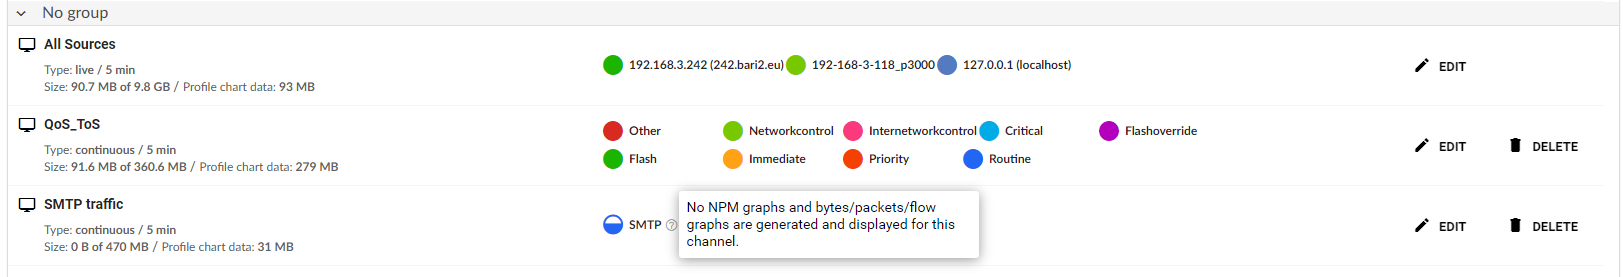
We have improved Flowmon responsivity and overall performance for customers with multiple sources and channels. It is also possible to configure channels not to calculate NPM or traffic charts if not needed which can further help to reduce the load of the appliance and help to improve performance.
New channel options
New channel options
New channel options
Support for SSL information from Gigamon devices
Flowmon captures SSL information (such as server Server Name, Server Cipher and others) from flow data received from Gigamon devices. Additional information can be found on the support portal in the document “Supported Flow Standards Specification”
Documentation in HTML
We have replaced the existing PDF documentation with HTML version which allows easier navigation and enhanced search options.