Our solution has already been able to monitor and provide information from application layer for protocols such as HTTP, DNS or VoIP. Flowmon 8.0 brings the support for another two important protocols: DHCP and SMB to provide administrators with even deeper understanding of network traffic. All these L7 information significantly enrich the flow data (typically L3 and L4 information) which are exported from Flowmon Probes (or monitoring ports of virtual Flowmon Collector). Today we will take a closer look at the DHCP protocol.
Dynamic Host Configuration Protocol
Firstly, a little bit of theory. Dynamic Host Configuration Protocol (DHCP) is application layer protocol for dynamically distributing network configuration parameters, such as IP addresses for network interfaces, gateway IP address or other network parameters. DHCP protocol operates based on the client-server model and uses ports 67 for server (bootps) and 68 for client (bootpc). The principle is depicted on the following picture.
Figure 1: DHCP principle.

Picture captures two client states.
- Initialization state: After first connection / login into the network, client is in initialization state and tries to contact DHCP server by broadcasting DHCP Discover message. DHCP server replies with unicast DHCP Offer message which contains offered IP address, lease time and other network parameters. Client replies by broadcasting DHCP Request with offered IP address and server acknowledges the request and IP address allocation by sending unicast DHCP Ack.
- Renewing state: If the client had already allocated IP address, the communication is shortened to so-called two-way-handshake. Client sends DHCP Request and the request is acknowledged by server sending DHCP Ack.
Enough of theory although there is more to know about DHCP protocol. Let’s have a look at what you can see in Flowmon.
DHCP Monitoring in Flowmon
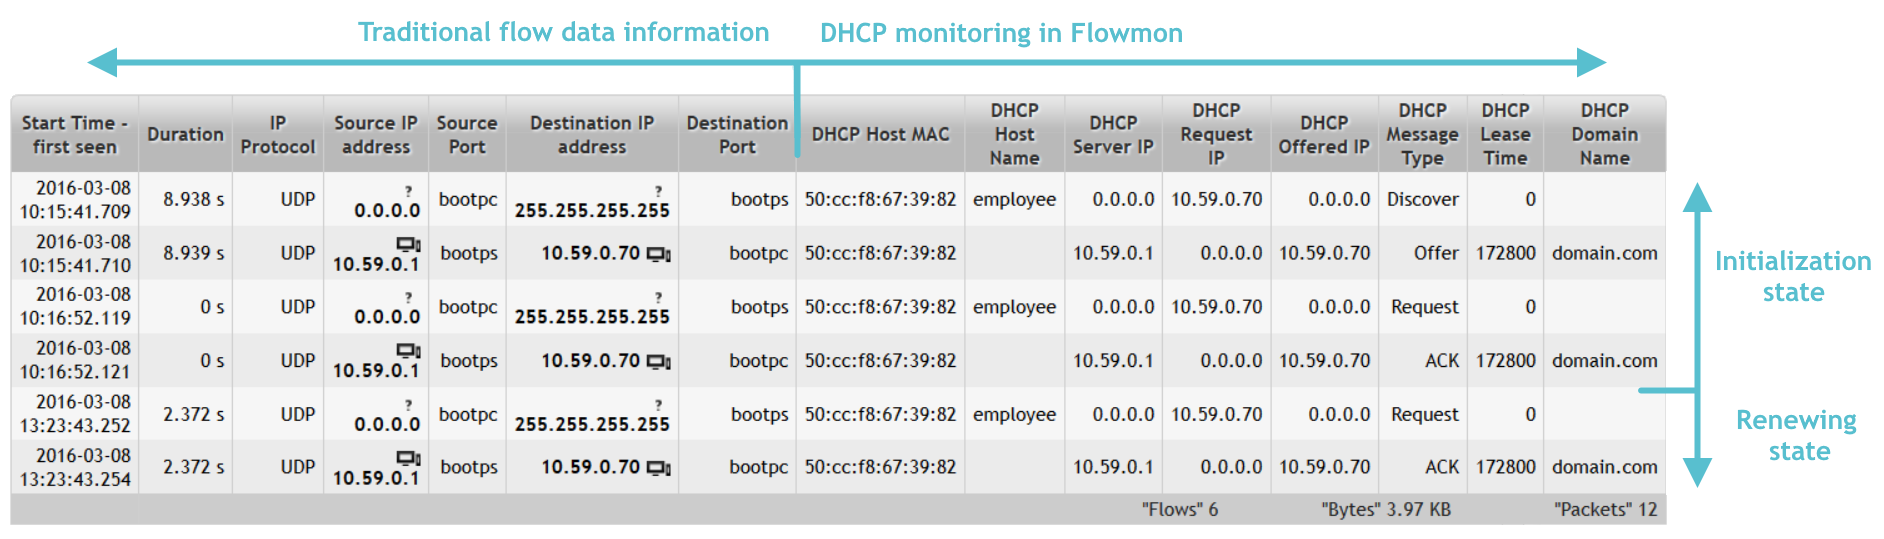
Figure 1 captures DHCP communication between host (client) and DHCP server. On the following picture, we can see the corresponding communication in Flowmon. Every part of communication on figure 1 (DHCP messages 1 through 6) corresponds with one row of the list records in Figure 2. Host Employee has connected to the network around 10:15 am. Host was in initialization state. Communication went correctly according to DCHP behavior described in paragraph above. Around 13:23 host renewed lease of IP address.
Figure 2: DHCP communication in Flowmon Monitoring Center.
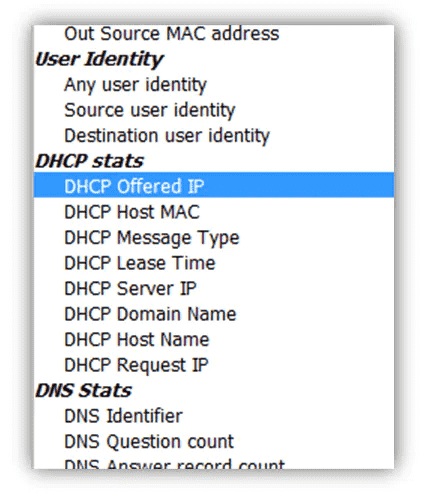
Note the difference between what you can get from the L3/L4 and what additional information and deep insight is brought by Flowmon. In the following picture, you can see what parameters you are able to monitor.
Figure 3: Monitored DHCP parameters.
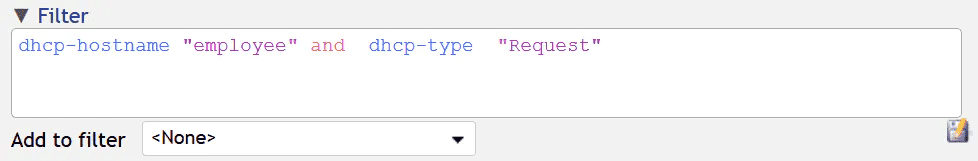
It goes without saying that you can filter the network traffic using all DHCP parameters above. Filtering flows helps with network troubleshooting and allows Flowmon users to create profiles, reports and alerts (examples below).
Figure 4: All DHCP parameters can be used for filtering flow records.
DHCP Troubleshooting Using L7 Visibility
Monitoring and visibility into DHCP protocol simplifies network management to administrators and provides them with various benefits – from basic DHCP operating logging and host identification to solving and troubleshooting various use-cases.
Host Identification and Basic Troubleshooting
Host Employee is reporting issues with connection to the network. To find out, whether the problem is in DHCP, we can use several parameters to filter flow corresponding to particular host. We can use his MAC address and use filter “dhcp-hostmac host_mac” or even use his host name and use filter “dhcp-hostname host_name” . As a result, we will see whether the problem is in DHCP. We might see similar result to this one:
Figure 5: DHCP server replies with DHCP NAK.
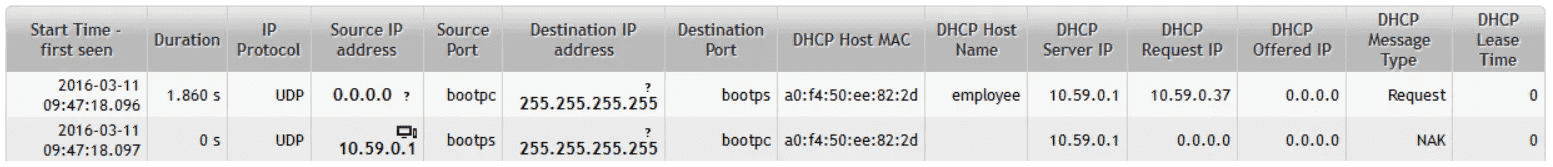
Figure 5 shows that employee is requesting IP address and DHCP server replies with DHCP NAK message. Using DHCP NAK the server declines host’s request for IP address allocation. We can also search for DHCP NAK messages using filter “ dhcp-type “NAK”” and see, what hosts have their requests declined.
DHCP Relay Agent
Another use-case is troubleshooting and visibility into communication between DHCP Relay Agent and DHCP Server. This is not possible without visibility inside the DHCP protocol itself. The technical insight is as follows. Flow records are commonly aggregated using five attributes: source & destination IP addresses, ports and protocol number. Communication between DHCP Relay Agent and DHCP Server has the same five attributes even when the Relay Agent is forwarding DHCP Requests from different clients. Without mapping and extending the five attributes with DCHP attribute from application layer (L7), all the communication between DHCP Relay Agent and DHCP Server and thus all forwarded DHCP Requests from clients would be represented as one flow record with high packet count.
Figure 6: Communication between DHCP Relay Agent and DHCP Server.
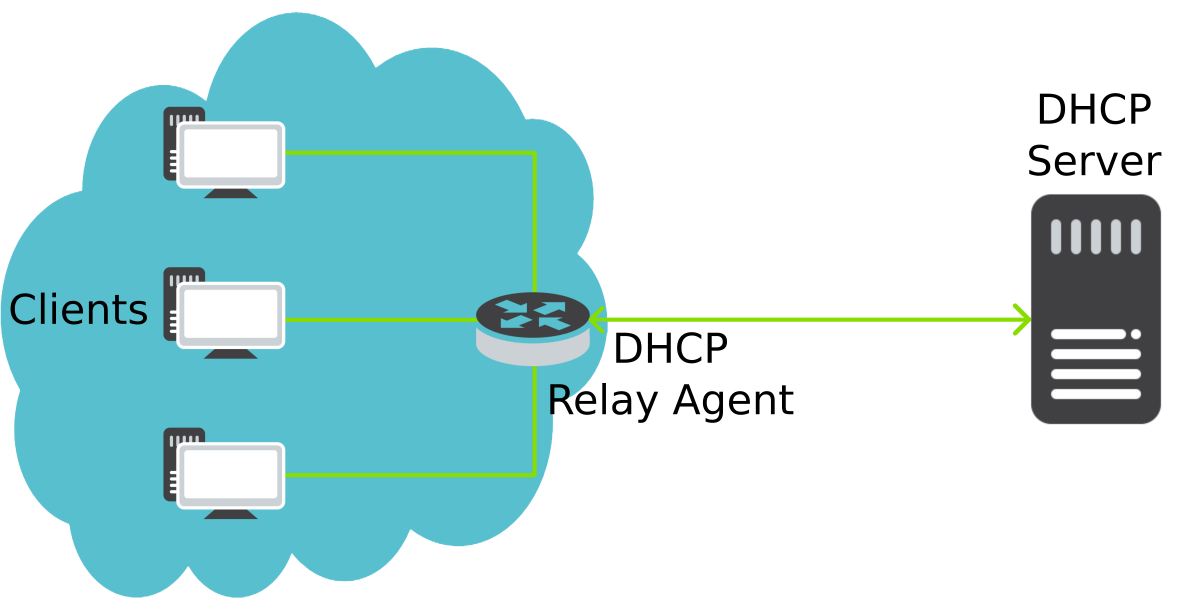
Thanks to the visibility into DCHP protocol, we are able to see individual communications between clients and DHCP Server which are going through the DHCP Relay Agent. This is achieved by adding DHCP Host MAC as a key field (attribute) for aggregation of flow records.
Other DHCP Use-Cases
Not every DHCP use case needs L7 visibility. For example detection of DHCP rogue server . DHCP rogue server is unauthorized server that also offers client’s IP addresses and other network parameters like default gateway and DNS server IP addresses. Such server represents not only operational but also security risks. From operational point of view, clients may experience problems with network access or communicating with other hosts due to incorrect IP or gateway. From security point of view, DHCP rogue server can be used by attackers for various network attacks (man-in-the-middle, sniffing and reconnaissance attacks).
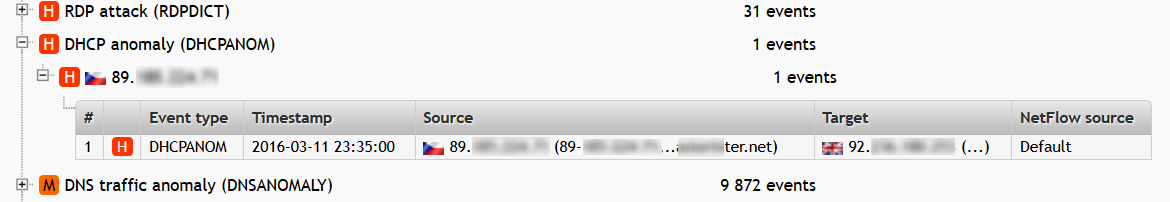
DHCP rogue server detection can be handled by both Flowmon Monitoring Center and Flowmon ADS. Let’s start with Flowmon ADS. Flowmon ADS is equipped with DHCPANOM detection method. This method automatically detects non-legitimate DCHP servers, reports and alerts on such event. Using learned behavior of network nodes, the method can also detect anomalies in DHCP traffic.
Figure 7: DHCP anomaly detection in Flowmon ADS.
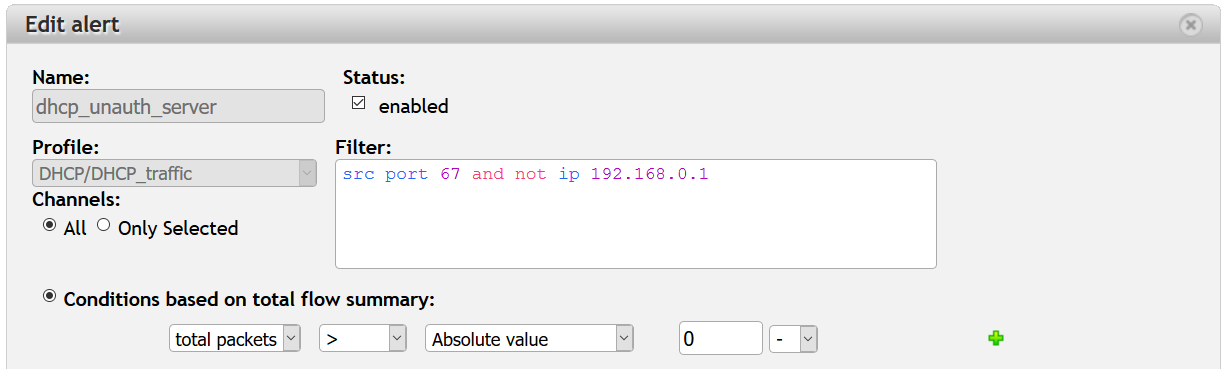
To detect DHCP rogue servers in Flowmon Monitoring Center, we can set up alert. Alert can be configured using filter src port 67 and not ip dhcp_server_ip and setting condition for number of packets exceeding 0. Now we will be alerted, when other host then DHCP server starts to send DHCP messages of DHCP server.
Figure 8: Alert configuration for detection of unauthorized DCHP server in FMC.
Profiles, Reports and Alerts
Using filtering rules and DHCP parameters makes it possible to set profiles, reports and alerts.
Let’s now create profile for DHCP traffic. I’m showing simple example of profile where I use filter “dhcp‑type “NAK””. I will be able to see how many “NAKs” are in my network. Using filters src port 67 and src port 68 I am able to create two separated channels for DCHP traffic from server and client.
Figure 9: Setting up DHCP profile.
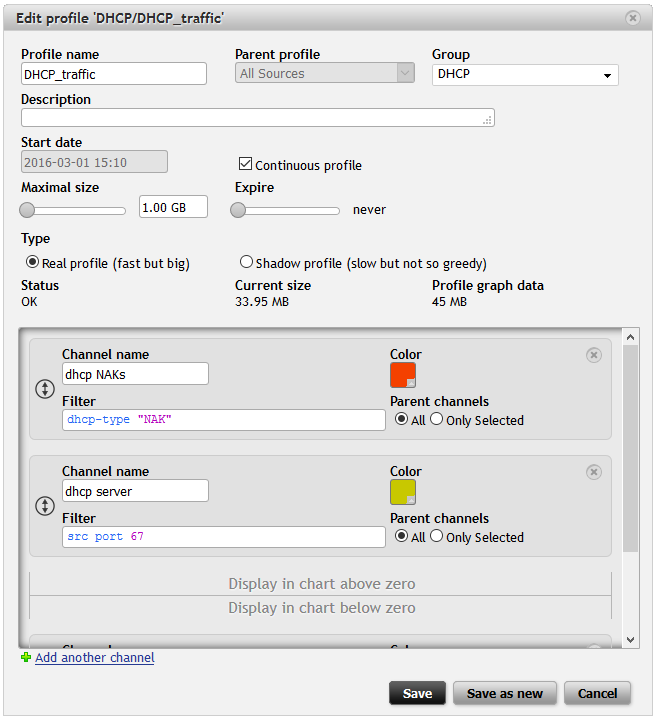
I have created DHCP_traffic profile and added three channels. One is for communication from server, another for communication from clients and last one for DHCP NAK messages. Communication from clients will be displayed in the chart below zero. You might now noticed some changes in GUI – I will get to that in the next blog post.
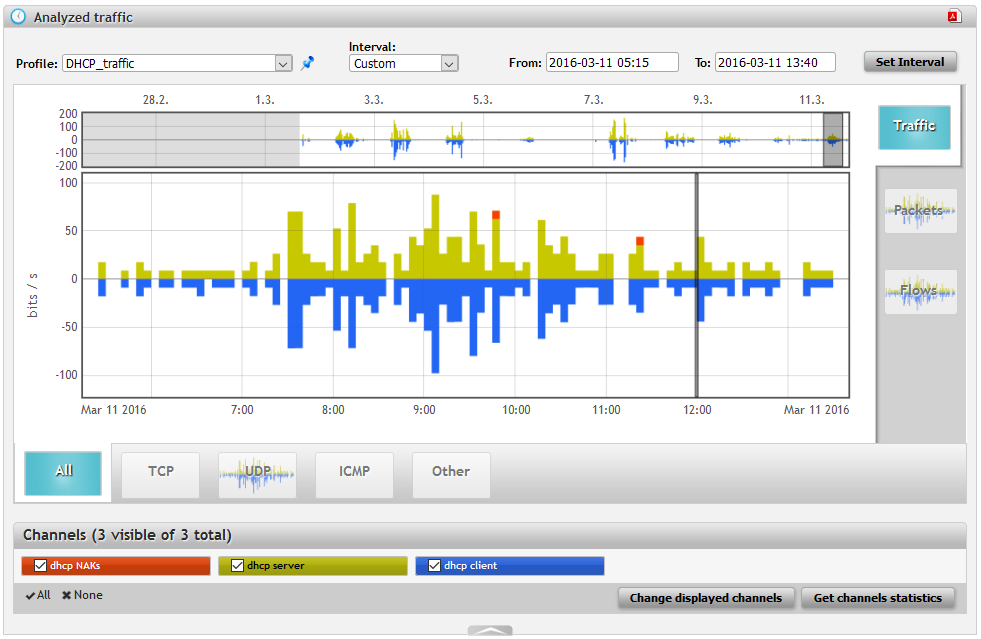
Everything is ready after hitting “Save” button. The results are on the following picture. Green is for server , blue is for client . Seeing big asymmetry in the traffic could represent some problems with DHCP. Red parts are DHCP NAK messages. So having a glance at this chart I can say that there is no problem with DHCP on my network.
Figure 10: DHCP traffic profile in Analysis.
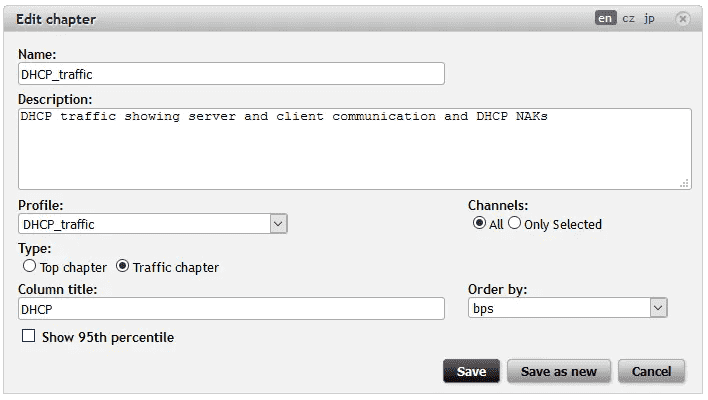
As a next step I have created report to be automatically reported about DHCP traffic. First I have created chapter with DHCP traffic using DHCP_traffic profile created in the previous step. Next step was to create report using the chapter and schedule time of sending.
Figure 11: Chapter setting.
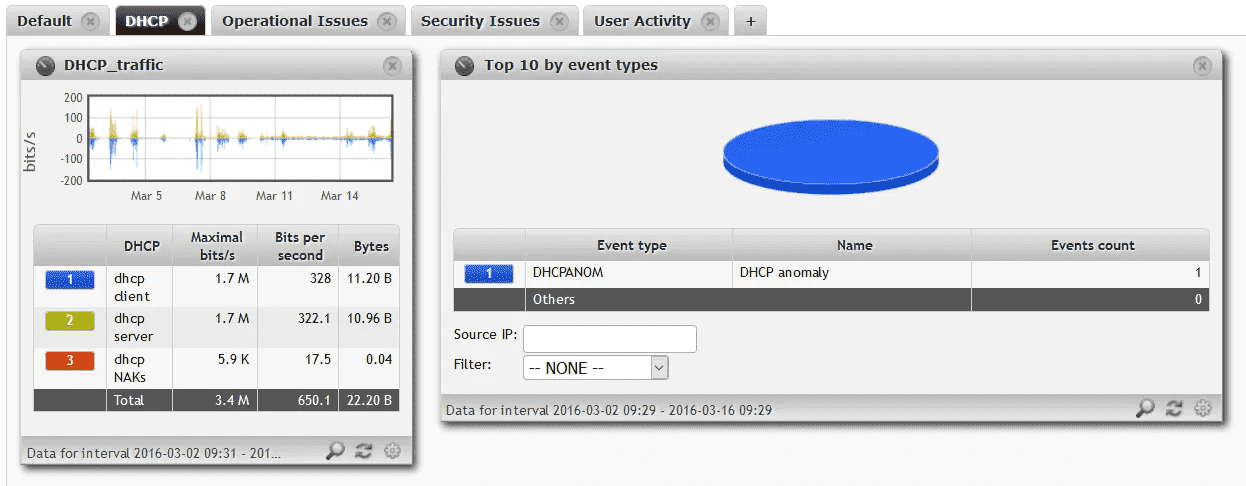
Created chapter was added as a widget into dashboard in FMC and Flowmon Dashboard. It allows me to immediately see DHCP state. Picture below shows Flowmon Dashboard.
Figure 12: DHCP tab in Flowmon Dashboard using widgets (chapters) from FMC and Flowmon ADS.
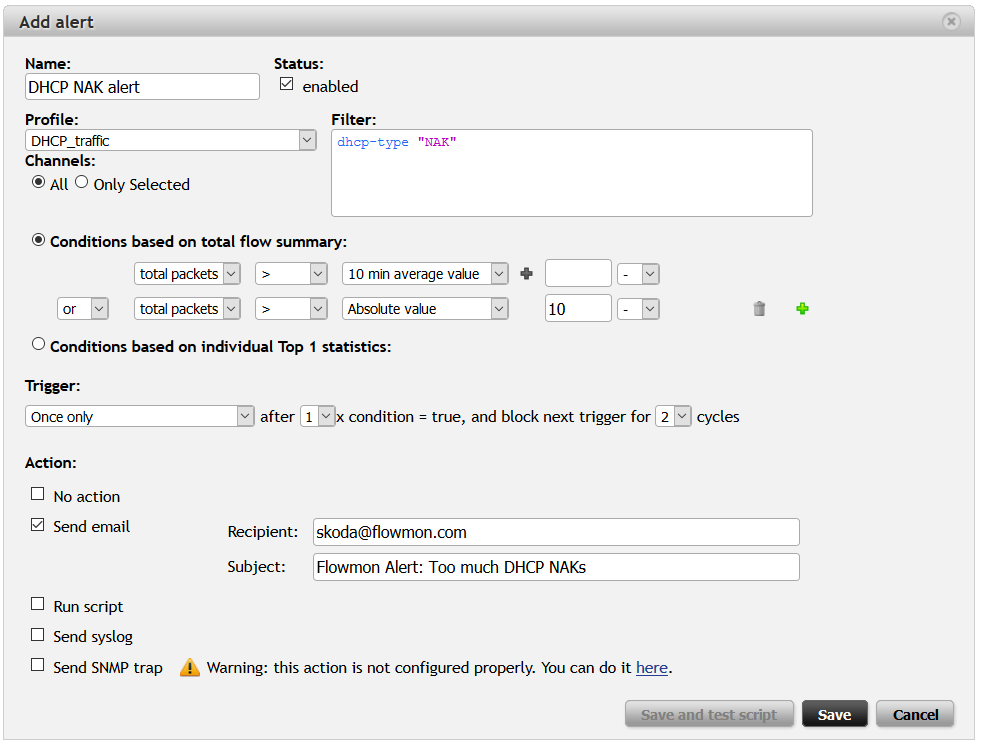
I also wanted to immediately know, if there is too much NAKs. So I have created alert which will alert me in case something goes wrong. I have configured condition for sending alert as number of NAK packets above absolute value and 30 min average value. Now if something goes wrong and hosts get their request for IP address allocation declined, I will know immediately.
Figure 13: Alert configuration.
How to try it?
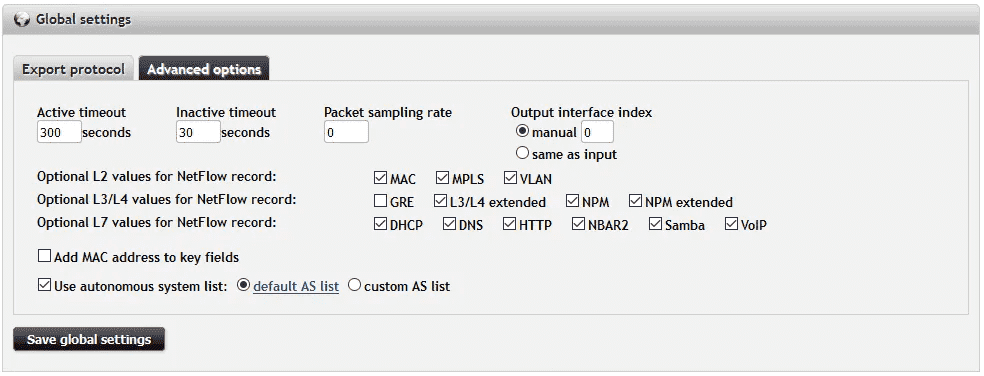
Are you interested in getting visibility into application layer? Download our free trial – virtual Flowmon Collector equipped with 2 monitoring ports (Flowmon Probe functionality). Follow the quick start guide attached to the zip file to quickly deploy the trial version. After deploying virtual collector into your VMware or Hyper-V environment, go to the Configuration Center – Exporters. Set IPFIX export protocol, go to Advanced options and check DHCP, Samba or any other L7 protocol and click on Save.
Figure 14: Exporter configuration.
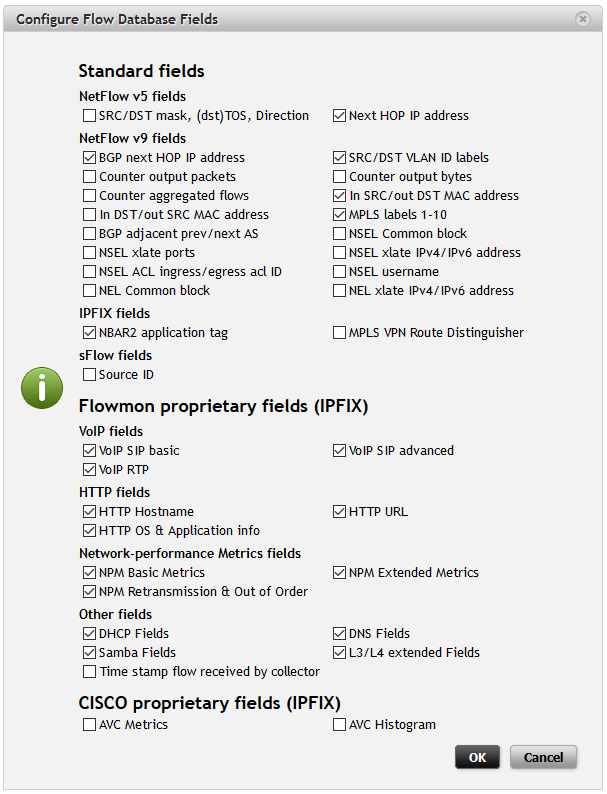
Now the monitoring ports of virtual Flowmon Collector are exporting information from L7. Next step is on collector side to show this information. Go to the Configuration Center – FMC Config and click on Configure Flow Database Fields . Here check the protocols and data you have selected in previous step and click Ok . And that’s it. Now you are monitoring L7 protocols and enjoy the benefits of deeper L7 visibility.
Figure 15: Flowmon Collector flow database fields.
Learn more
Learn more from our latest webinar about news in Flowmon 8 and Flowmon ADS version 8 at the Flowmon YouTube channel. Stay tuned for more blog posts and news from Flowmon 8. We will be talking about Samba protocol monitoring next time.
Get the insight with Flowmon. Try out the Flowmon Live Demo or free TRIAL and stay in touch for further information on our products!