Network Performance Monitoring
Network infrastructure is the nervous system of every business. Its outages, bottlenecks, delays and other issues can cause real troubles to employees and negatively impact customers. Network Performance Monitoring (NPM) tools help administrators to avoid these situations, troubleshoot performance issues and distinguish between delays caused by the network itself and delays caused by applications and services.
Launch demoFlowmon NPM measurement tool with microsecond precision
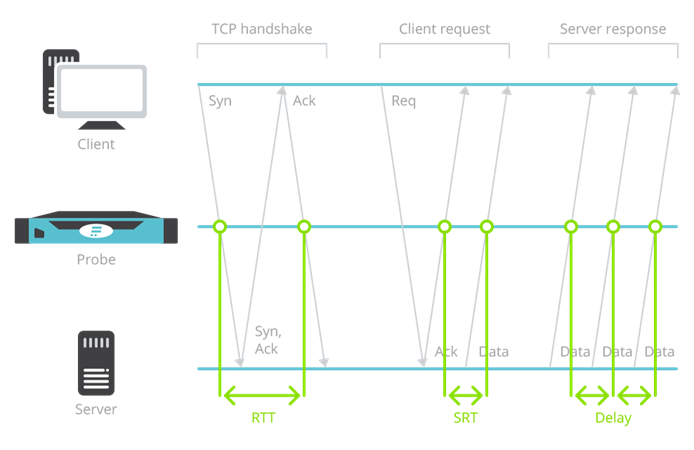
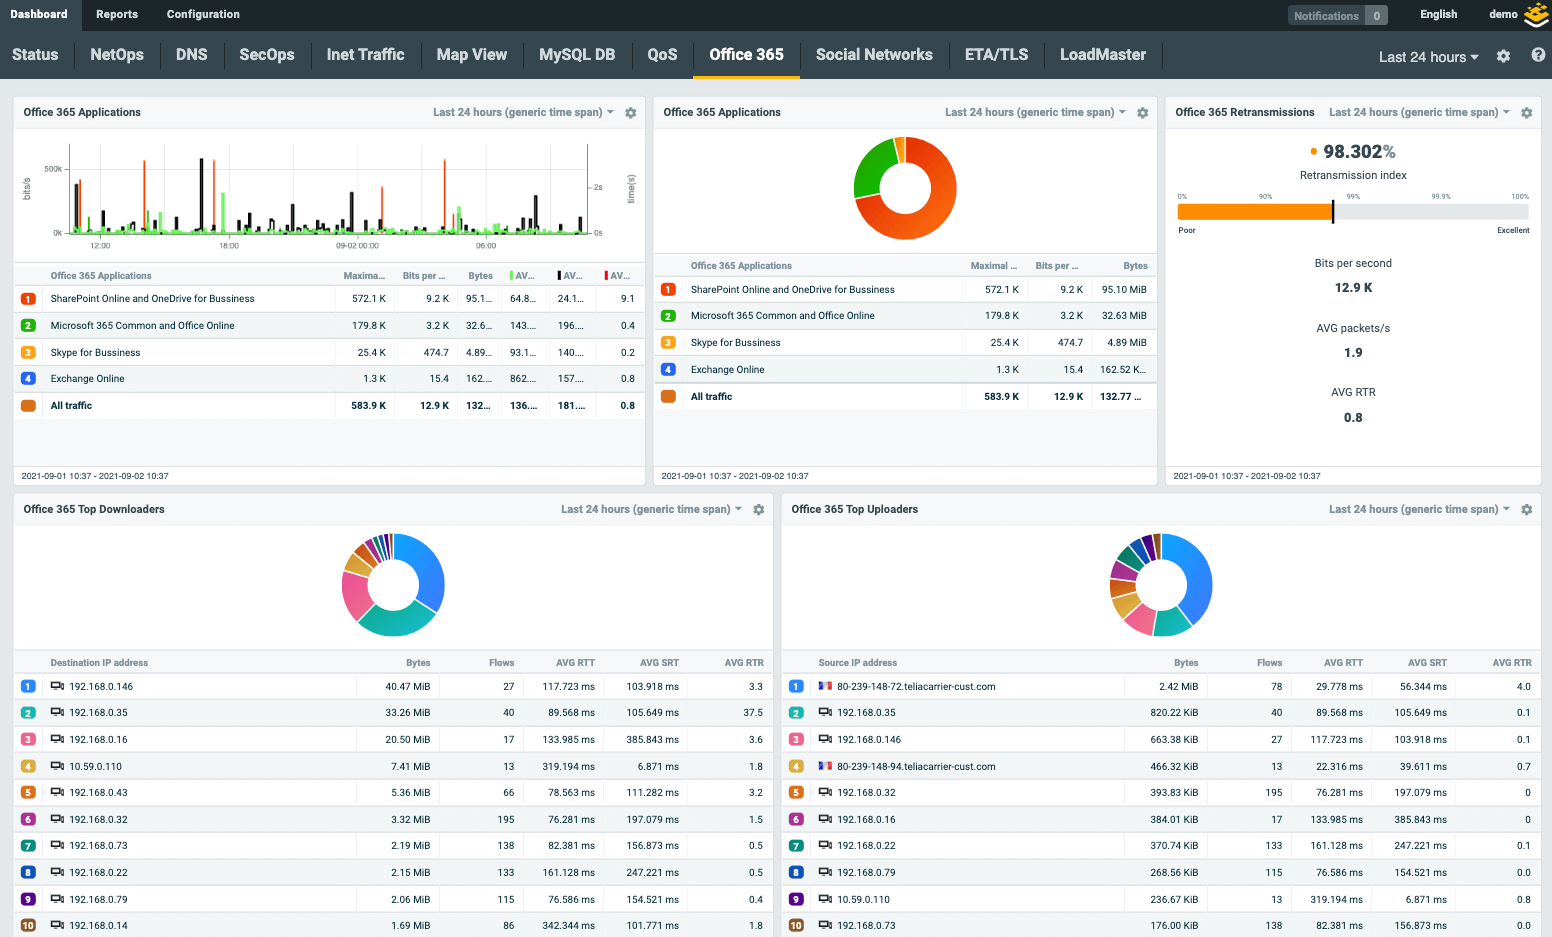
Flowmon Network Performance Monitoring solution provides various performance indicators and statistics of IP communication, such as RTT (Round Trip Time), SRT (Server Response Time), Delay, Jitter and others. The solution is based on Flowmon enterprise extensions where Flowmon Probe delivers performance indicators as a part of IPFIX statistics to Flowmon Collector which is able to store and report on these statistics. Flowmon Collector is compatible with Cisco standard called AVC (Application Visibility and Control) so the performance indicators can be also gained from Cisco devices. Measured NPM characteristics are available as a part of top statistics, analysis and reports in Flowmon Monitoring Center (FMC). Dashboard widgets in FMC can be set up to monitor response time of critical application or monitoring round trip time in your network towards important servers and systems (server response time over HTTP/HTTPS, delay when communication with company data storage, etc.).

With Flowmon network admins benefit from these indicators:
- RTT (Round Trip Time) – delay introduced by the network itself, length of time it takes for a data packet to be sent plus the length of time it takes for an acknowledgment of that packet to be received, this indicator is measured from clients to server in TCP traffic.
- SRT (Server Response Time) – delay introduced by network service or application itself, length of it takes for the server to start sending data after the request from client is accepted and confirmed, this indicator is measured from server to client in TCP traffic.
- Retransmissions – number of retransmitted packets which were damaged or lost.
- Delay – time delays between packets, minimal, maximal, average value and deviation, this indicator is measured in both direction of network communication.
- Jitter – calculated from delay as variance, minimal, maximal, average value and deviation.
- Out-of-order Packets – number of packets delivered in a different order from which they were sent.
Performance statistics in Flowmon dashboard

Request free trial
Get no-obligation 30-day trial of Flowmon in your network.
Get your trial today