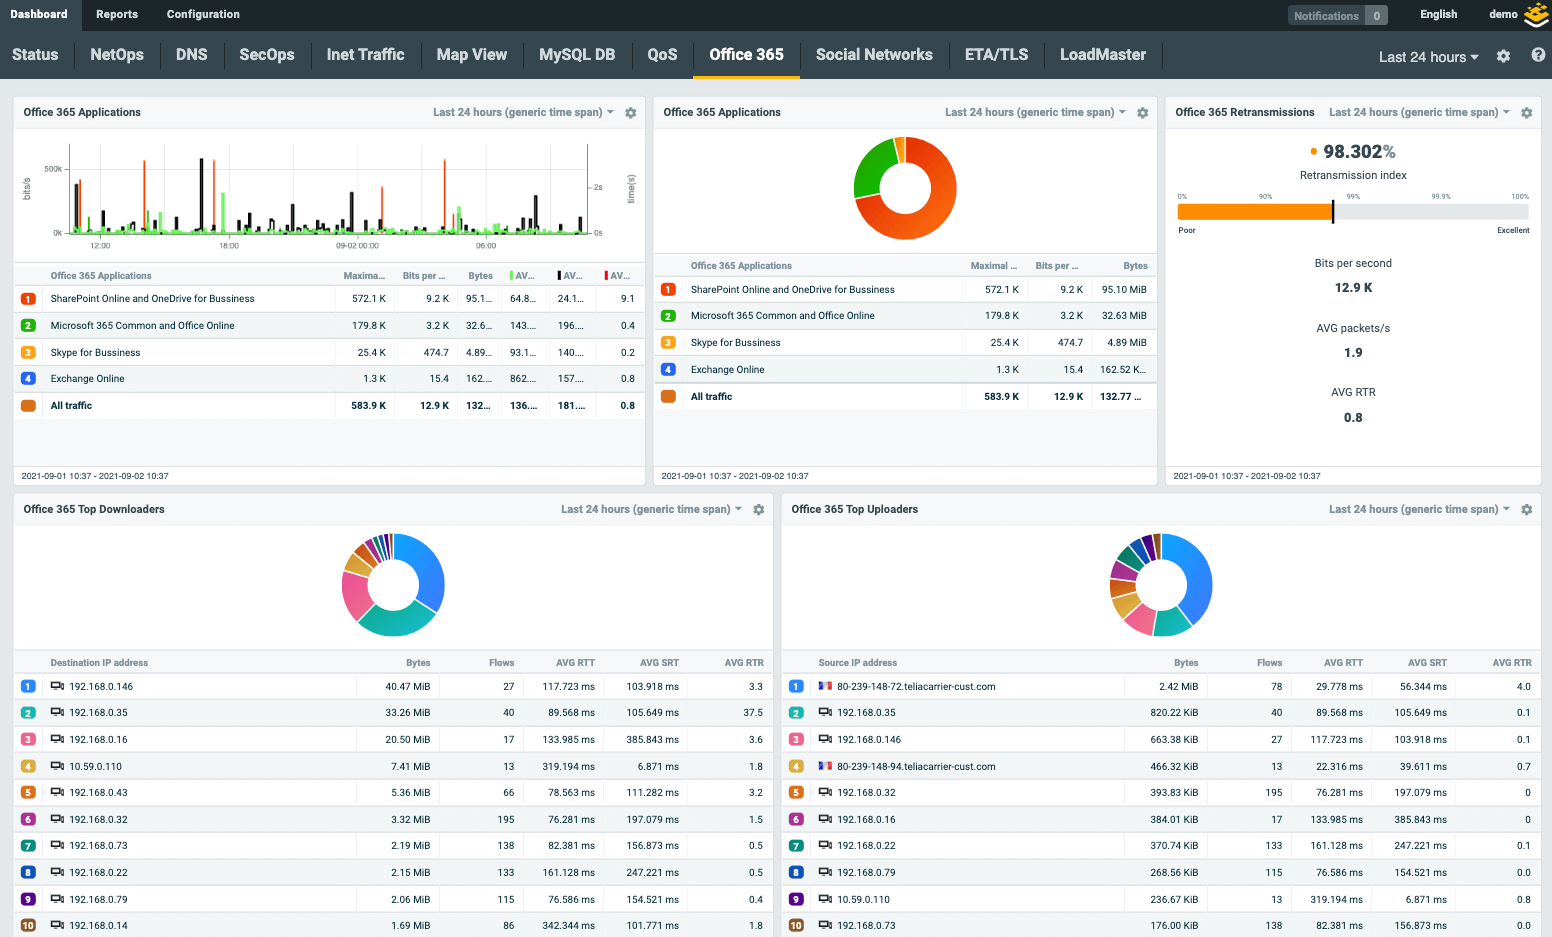
SaaS Performance Monitoring
Maintain SaaS application performance through network visibility. The promise of the SaaS adoption is to reduce the IT resources required to support application delivery. The reality is that the SaaS adoption causes a shift of priorities in the battle to regain control over the quality of mission-critical systems. Since an employee can connect to an app from a mobile phone connected via crowded airport Wi-Fi, NetOps usually have little chance of ensuring a smooth service.
Launch demoGet a control of your SaaS applications
The lack of visibility and lack of understanding of the communication channels between the applications and end-users may cause communication chaos, paralyse company operations and significantly lower the ROI of adopting SaaS.
Knowing whether the fault is within the network between the affected SaaS user or at the SaaS provider's side a key piece of knowledge that cures a lot of headaches and substantially lowers the impact of SaaS performance issues.
The lack of visibility and lack of understanding of the communication channels between the applications and end-users may cause communication chaos, paralyse company operations and significantly lower the ROI of adopting SaaS.

Find the cause of SaaS performance degradation
Since the hot potato of SaaS performance issues usually ends up in the lap of NetOps, having the right data can significantly help them hasten the remediation process.
Typically when SaaS performance degrades, there can be 3 different scenarios:
How to fix slow SaaS applications
To distinguish between these scenarios, Flowmon uses a non-intrusive method of network performance monitoring by collecting Netflow/IPFIX data. The solution provides network performance metrics from both the local side and the SaaS provider’s side.
In short, Flowmon outright tells you which of these 3 scenarios is your case.

Network performance metrics for the entire path the SaaS data travel
To distinguish between these 3 scenarios, Flowmon measures the round trip time (the time it takes a packet of a TCP handshake to travel from the local network to the SaaS provider and back), server response time (the time it takes for the SaaS provider’s server to respond), jitter (variance of delays between packets) and volumetric statistics (the volume of data that travels at a given moment).
These metrics typically help to distinguish between the 3 scenarios in the following way:
These combinations of values help to diagnose where the fault lies. Additionally, volumetric statistics can help to diagnose whether the capacity of the local link can carry the SaaS load. Jitter can help to reveal unstable network connections.
Request free trial
Get no-obligation 30-day trial of Flowmon in your network.
Get your trial today