A general explanation of RTT and SRT principles can be found in my previous blog. This time I will guide you through the setup of Flowmon to get demanded answers. All the respective features are available through Flowmon Monitoring Center. To replicate the following steps, you can either use your own Flowmon instance or our demo environment.
Log into Flowmon Monitoring Center
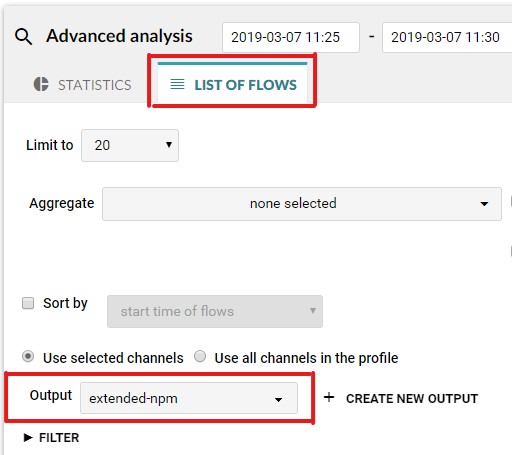
Select “Analysis” in the left panel menu
In section “Advanced analysis” switch to “List of flows” tab
Select item “extended-npm” from “Output” drop down list
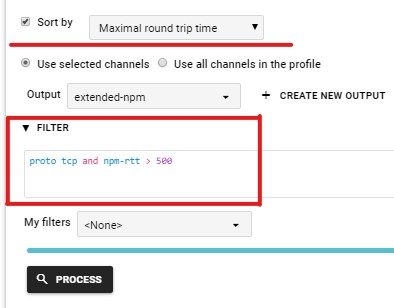
Now adjust the time window and use a filter to look for specific traffic. For example, let us search for traffic with RTT higher than 500ms and sort the results by the worst value by the Maximal Round Trip Time.
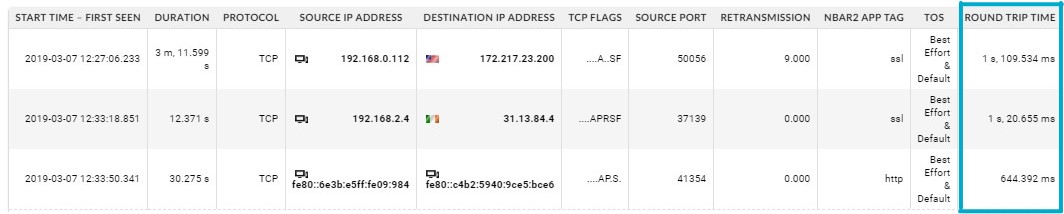
As a result, we get a list of network connections with the highest RTT. The first two rows are no surprise as they represent communication between internal IPs and servers located on the public internet where high RTT values are expected.
Let me give you a few other examples. We can combine any filters based on attributes of flow records using logical operators such as AND, OR, NOT, so your queries can be a really powerful way to narrow down to specific traffic we are interested in.
RTThigher than 1ms and lower than 50ms:
● proto tcp and npm-rtt > 1 and npm-rtt < 50
SRT higher than 2 seconds for a specific HTTP application:
● proto tcp and ip 10.208.31.100 and port 80 and npm-srt > 2000
Same as above but using the HTTP hostname instead of the IP address to
identify the application (the application can run on any port including TLS encryption):
● proto tcp and hhost “crm.ourcompany.com” and npm-srt > 2000
Detailed filter syntax is explained in the chapter “Filter syntax” of the Flowmon product user guide available in the user interface.
It is obvious that observing of RTT and SRT with Flowmon is quite straightforward. It is also good to use both metrics, RTT and SRT so that we can answer an important question: “Is it a network issue or application issue?” So we can immediately start resolving the incident or contact a responsible team or colleague.