Application performance monitoring (APM) is one of the key tasks and responsibilities of IT department to ensure smooth operations, satisfied customers and internal users working efficiently. Companies are investing in enterprise portals, online applications or information system to increase revenue, promote their brand and improve internal processes. But still they are missing tools to measure how efficient and beneficial these applications are. Lack of visibility leads to finger pointing and throwing the responsibility over different teams and departments.
APM is traditional domain of extensive agent-based software products that install agents on each and every server in your infrastructure and collect various metrics and statistics from your application servers. Flowmon APM is different. Pure network-based performance analysis engine does not affect you applications, is easy to deploy and easy to use. Without installing agents on servers, changes in IT infrastructure or changes in monitored system, applications are monitored from end user perspective. For all users, all user transactions and in the real time it provides detailed information on true application performance. Since Flowmon APM is based on passive technology of data capture with zero impact on the monitored systems, it does not pose any risks. Deployment and configuration is a matter of minutes due to complete independency on platform, operating system or target applications.
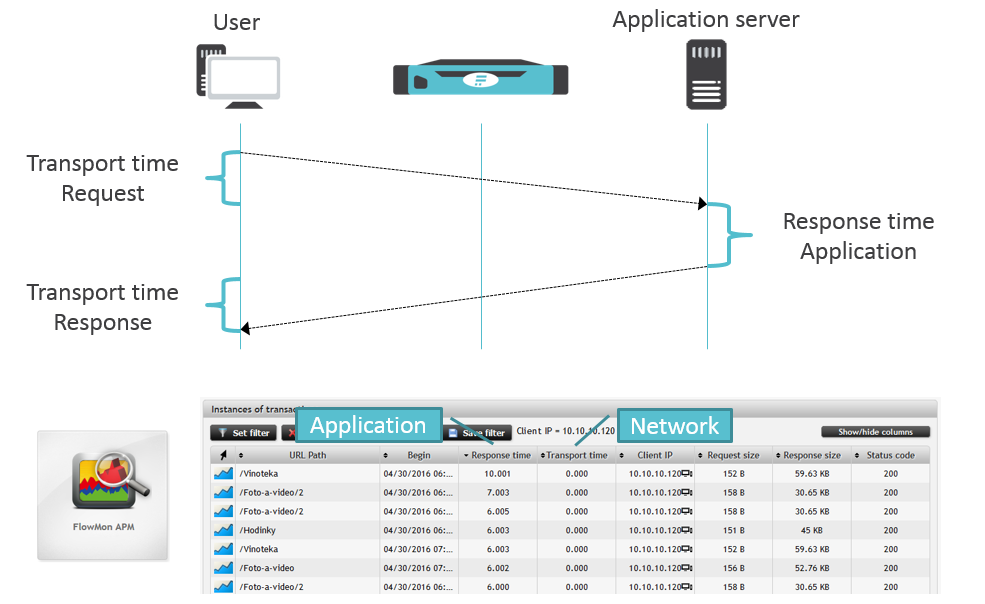
Figure 1: Principles of operation. Transport time (network delay) and response time (application delay) is measured and reported.
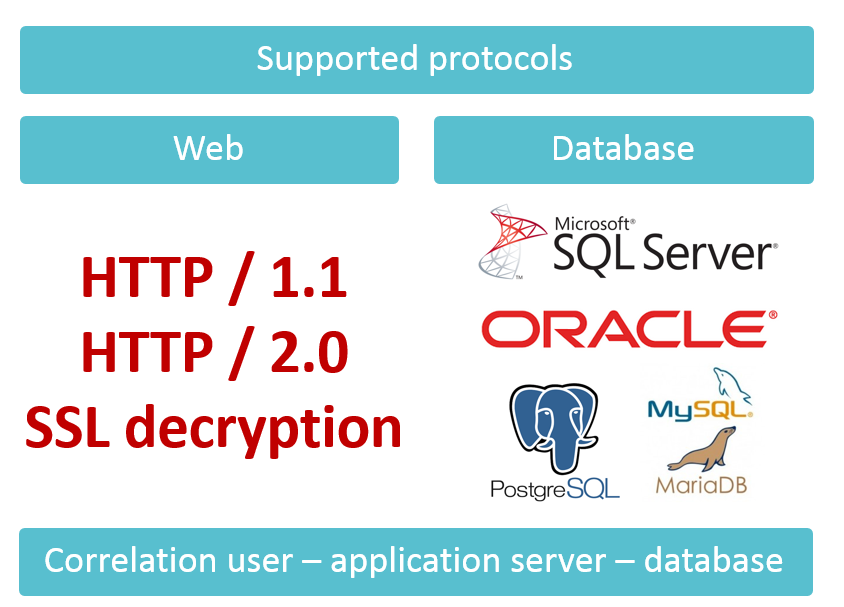
Flowmon APM supports various types of modern applications based on HTTP 1.1 or 2.0. If needed application traffic can be decrypted by providing a private key. On the database side all main platforms including Oracle or Microsoft SQL is supported. Main metrics that APM provides are response time, transport time and overall performance index (APM index) of the whole application derived from response time of all transactions with the respect to user-defined SLA. Thanks to APM index you can notify on performance degradation and ensure that requested SLA level is met.
Figure 2: Supported protocols.
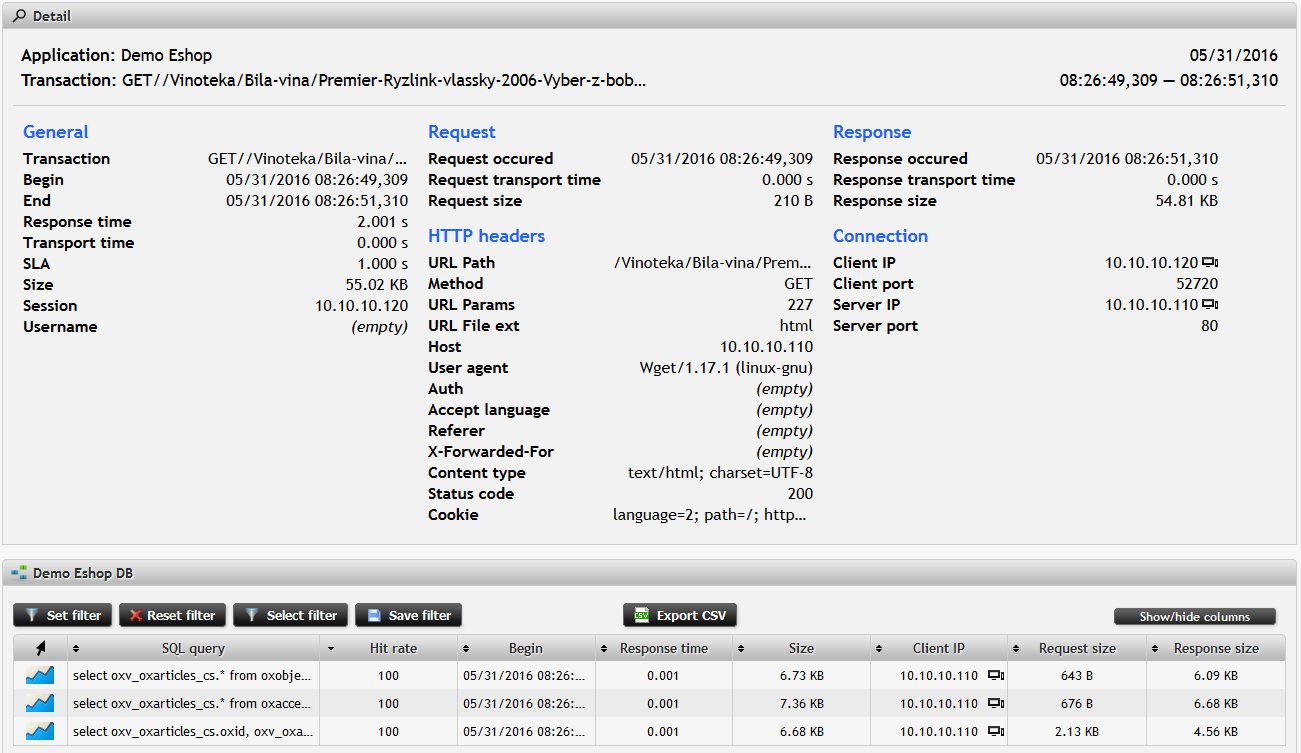
With correlation between user, application server and database server you can easily visualize all database transactions executed when certain web transaction was processed. This enables you to evaluate and distinguish between potential bottlenecks. Level of details is amazing, SQL query including all the parameters for database applications or full URL including parameters, user agent and server status code for web applications enables to optimize and troubleshoot applications on outstanding granularity.
Figure 3: Web transaction on e-shop with all details (top) and relevant database transactions due to correlation (bottom).
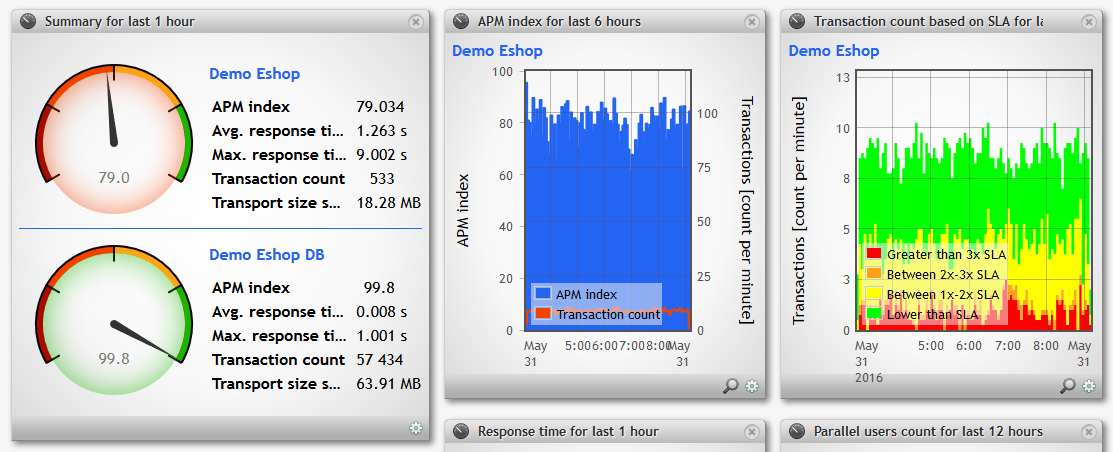
Last but not least you get your application performance dashboard – single point of view of company performance metrics with the ability to drill down when needed. Multiple dashboards per user, full customization and user permissions are matter of course.
Figure 4: Application performance dashboard. SLA compliance and APM index.
Agent-based solutions are completely out of range for small and medium size businesses due to slow time-to-value and long return of investment. Installing agents inherently pose operational and security risks. Agents increase the consumption of resources of the monitored servers and bring additional demands on the already overloaded system administrators. Every change in the operating system, database or web services means count for changes on the agent side. It is not unusual that the administrators switch the agents off. From the security point of view agent is third party software that is not always 100% under the control of the application owners. However, you see that you can do different. Network-based application performance monitoring will give you outstanding level of visibility while keeping your infrastructure untouched, secured and reliable.
Get the insight with Flowmon. Try out the Flowmon Live Demo or free TRIAL and stay in touch for further information on our products!