Monitoring of critical business services is becoming a real challenge as more and more companies migrate applications into the cloud. Communication between the client and the server no longer flows within the organization’s network, but leave the perimeter and head off to the cloud service provider infrastructure. Anything outside the perimeter is a huge blindspot. Additionally, most of the cloud services run on HTTPS – the traffic is encrypted so you rarely know how to pair packets of server response with the packets of a client request. So, how do you see who is experiencing slow response when communicating with cloud services? And how much data is transferred? How do you monitor cloud service usage?
Well, Flowmon does it in the three following steps.
Step One: Identify
Flowmon Probe is a key enabler when measuring cloud service usage . Usually flow data exported from traditional sources like switches, routers or firewalls doesn’t support the monitoring of application protocols. The Flowmon Probes can monitor various application protocols like HTTP, DNS, DHCP, SMB and others. This feature is called Flowmon IPFIX Extensions . It provides us with extended visibility into all layers and pushes traditional flow monitoring to its limits (see example of use-cases of DNS or DHCP).
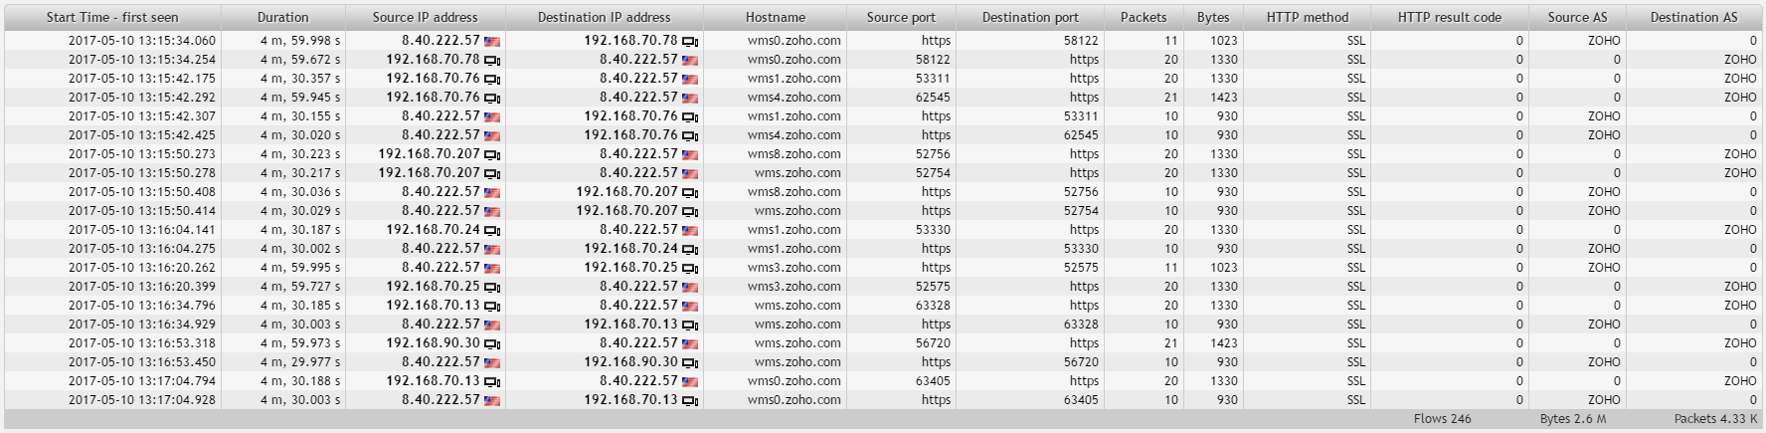
Visibility into HTTP/HTTPS is not enough though. Even if you have exporters which can monitor and export information about HTTP/HTTPS in the flow data, you need such information for both request and response to pair and differentiate individual requests and responses . Such functionality is available in Flowmon Probe from version 8.03. So the flows contain information about hostname, HTTP method, HTTP result code, etc. in both requests and responses. Yes, all the cloud services run HTTPS, but no worries - Probes monitor the SNI so we still get the hostname information.
Fig. 1: List of fows with client requests and cloud service responses.
Step Two: Measure
Now we have a list of all communications between users and cloud services, and for each communication a count of the number of bytes and packets transferred. Using HTTP hostname it is possible to create a profile in the Flowmon Monitoring Center showing the statistics about transferred traffic for each cloud service . So with these profiles you can create customized views on the data.
Fig. 2: Cloud services traffic chart including NPM metrics visualization.
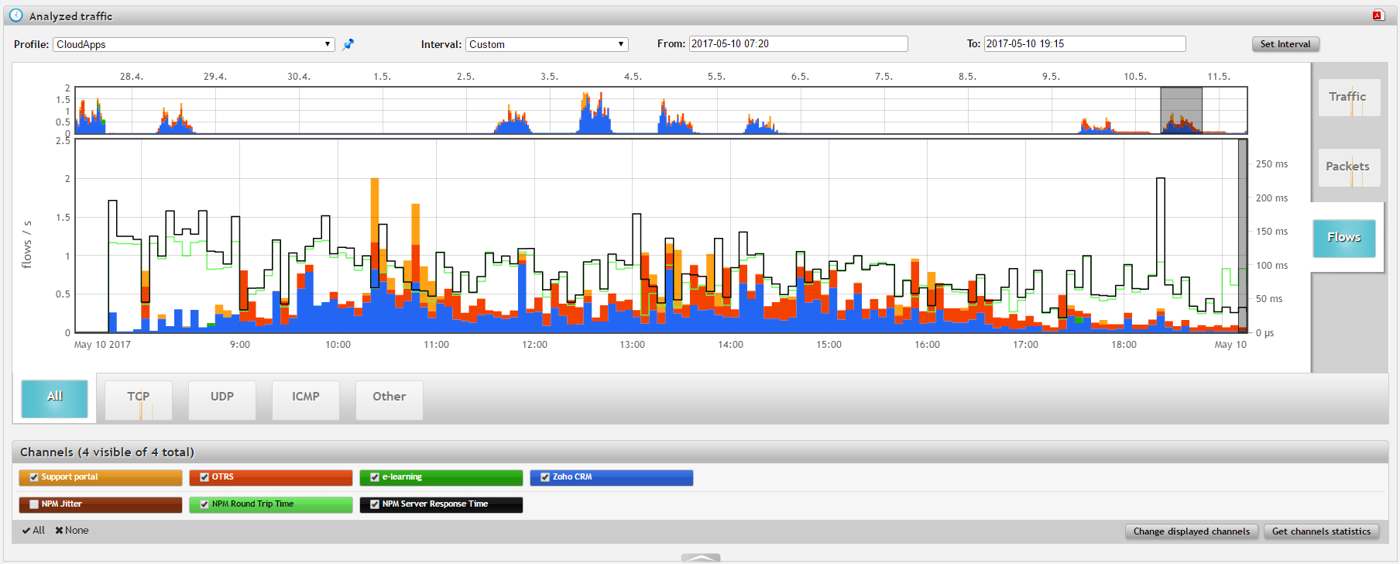
Besides visibility into the application layer, Flowmon IPFIX Extensions also enables the way to monitor network performance metrics. Network Performance Monitoring (NPM) metrics include information about Round-Trip Time (RTT), Server Response Time (SRT) and other statistics crucial for effective network troubleshooting (see example of use-cases). So for each communication between clients and cloud services (servers), you will see delays introduced by the network and by the servers.
Step Three: Analyze
The last step is to analyze measured statistics for identified communications with cloud services. The best way would be to analyze a created profile for all used cloud services (one channel per one cloud service / HTTP host). Then in Flowmon Monitoring Center / Analysis you can see the traffic chart with NPM metrics (picture above), get various top statistics or list through all the flows (communications) and see all measured data. Also, don’t forget to create reports to get the information about cloud services usage regularly and use report chapters (widgets) on your dashboard to have an immediate overview about transferred data...
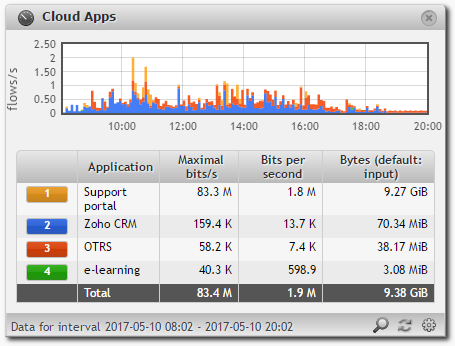
Fig. 3: Dashboard widged showing volumes of transfered data.
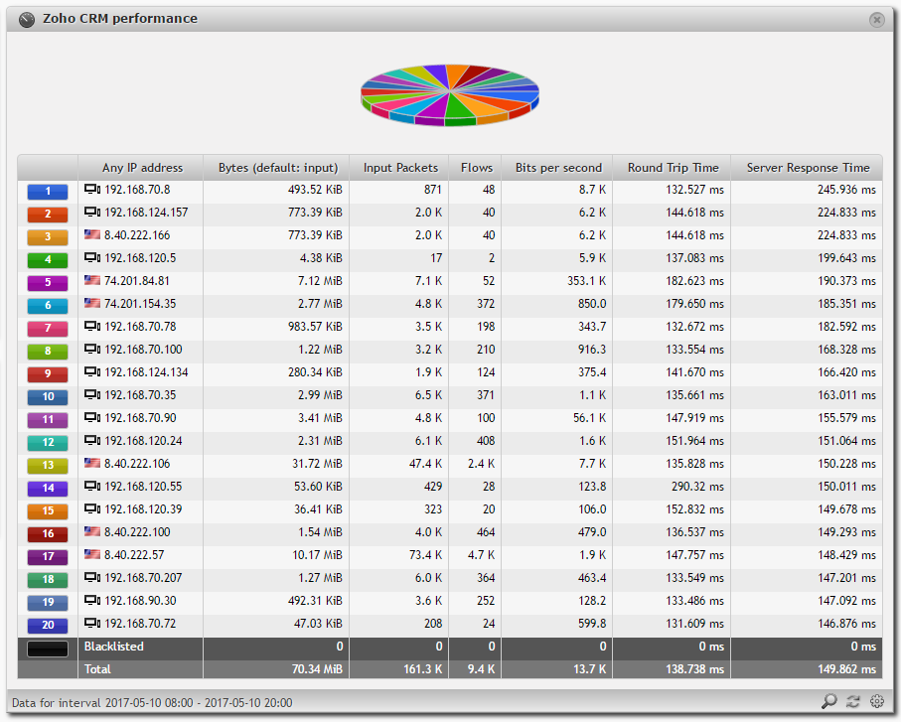
… or top statistics with hosts experiencing the highest Server Response Time in the widget below which also includes Round-Trip Time (RTT) – delay introduced by the network. Notice that hosts connected to wi-fi (networks 192.168.120.0/24 and 192.168.124.0/24) have slightly higher RTT (about 10ms higher) compared to hosts in the LAN (network 192.168.70.0/24). This is something you would expect but now you have in hands real measurement and you know real impact.
Fig. 4: Dashboard widged showing hosts experiencing the highest Server Response Time.
If you are interested in how the probe measures NPM metrics, check this previous blog post.
Conclusion
And that’s all. Using Flowmon Probe features you can identify, measure and analyze cloud service traffic and get an idea about volumes of transferred data and performance metrics indicating delays users are experiencing.