Flowmon Monitoring Center allows a way to be alerted on specific situations in a network. When a specific event occurs, action is taken automatically. Just set the right filter with the right condition and you will know at once about such events when they occur in your network. An option to filter primary data using various parameters of the network traffic allows you to cover many different use-cases.
Use-cases
Here is just a sample of example events we can be alerted on:
- High data transfers – top talkers using network bandwidth, high uploads or downloads can represent data exfiltration, using P2P, or other violations of company policies.
- High amount of connections – can represent unsuccessful connections e.g. due to service unavailability or security incidents such as port scanning.
- Problems with network connections – when hosts do not receive the network configuration from the DHCP server, communications with high network delay or retransmissions.
- And much more...
How to create an alert
Alerts are defined using a filter applied to a selected profile, and defining the condition and action trigger. Alerts can be found in GUI in Flowmon Monitoring Center (FMC) → Alerts. To create an alert, click on the “add new alert…” button.
Figure 1: New alert window in Flowmon Monitoring Center.
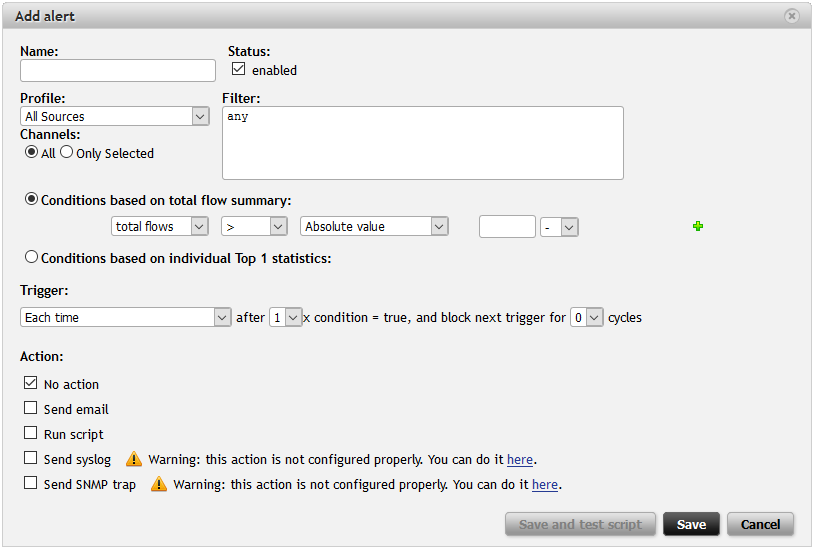
Fill in the dialog window to create an alert.
- Name: Enter the name of the alert.
- Profile and Channels: Select the parent profile and all or just some channels of the selected profile. The selected profile and profile channels need to contain data relevant to the alert.
- Filter: Specify the filter applied to the parent profile/profile channels. The conditions of execution depend on this filter.
- Conditions of execution : Select the definition of the condition based either on the total flow summary or on individual top 1 statistics. You can choose whether the number of flows, packets or bytes is higher or smaller than the absolute value or average value for a specified interval.
- Trigger: Specify how often the action (defined below) is triggered. You can define whether the action is triggered each time, once only or once only while the condition is true. Then you can define how many times the conditions must be met to trigger an action and also to disable the trigger for several cycles.
- Action: When the condition is met, you can configure the alert to trigger action(s) or do nothing (in this case you are informed only in Flowmon GUI that the alert was fired). First of all, an email can be sent to a specified email address. When an
alert is triggered, you will receive an email with information about what happened and either with the flow summary or top statistic based on what type of condition of execution you selected. The second option is to run a user defined script .
You can use the script to send alert data and carry out countermeasures (e.g. reconfigure the SDN switch). The other two options are to send a syslog message in CEF format or send an SNMP trap . These last three options allow a way to integrate
Flowmon with third party solutions.
Example Alerts
Let us start with the Internet link utilization. In the following example case, our network is connected to the Internet through a 10Mb link. So this alert is configured with the profile selected as Internet and the condition based on the number of Mbits per second (8Mbps). No filter is necessary because of the selected profile, where we defined the upload (by filter “src net lan_ips and not dst net lan_ips” ) and download (by filter “dst net lan_ips and not src net lan_ips” ) channels.
Figure 2: Internet link utilization alert.
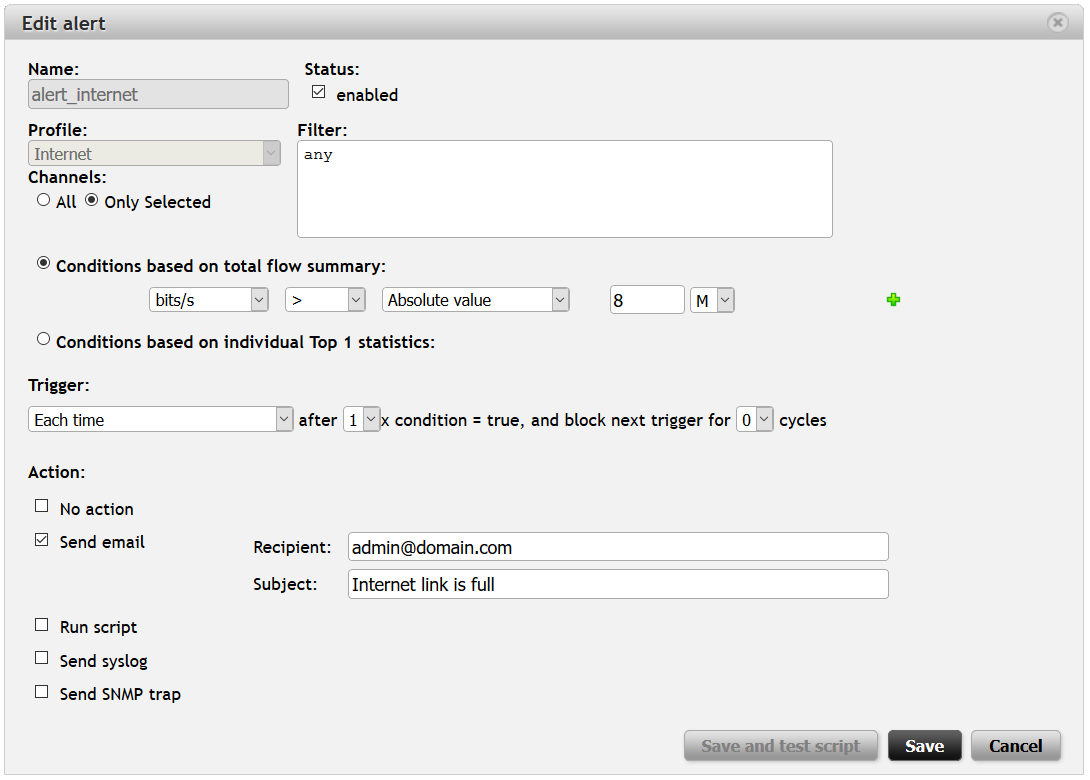
Whenever the Internet link is utilized over 80% of its capacity, we will receive an email with the flow summary (first type of condition) where we can see how many flows, packets and bytes were transferred for a corresponding five minute interval and what the rates (bps, pps, fps) were.
Using Application Layer Visibility
Flowmon Probes extends traditional flow monitoring with application protocol visibility (part of Flowmon IPFIX Extensions). Probes enable a way to monitor HTTP, DNS, DHCP, VoIP (SIP), SMB protocols, and soon also (in Flowmon 8.03) SMTP and SQL (TDS) protocols. Flowmon allows a way to create filters using information and parameters from these protocols, and thus enabling it to be used for alerting.
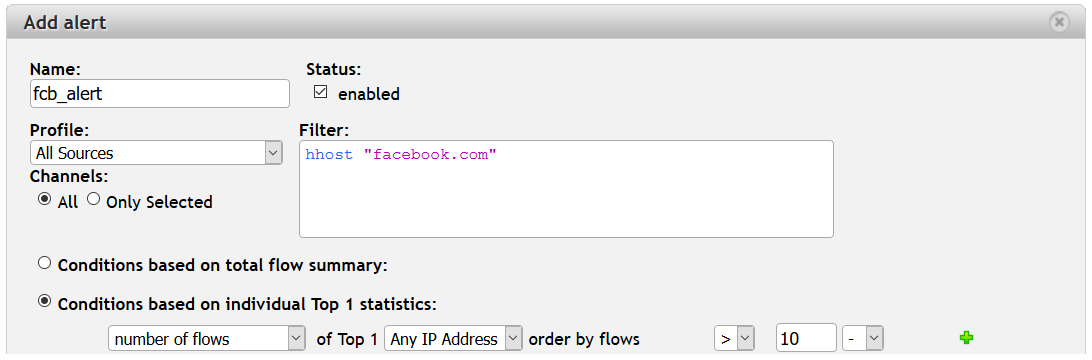
For example, you can use HTTP Host (filter hhost ) to be alerted about high volumes of video streaming from YouTube or twitch sites, blacklisted sites, etc.
Figure 3: Using HTTP protocol visibility to alert on specified HTTP Host.
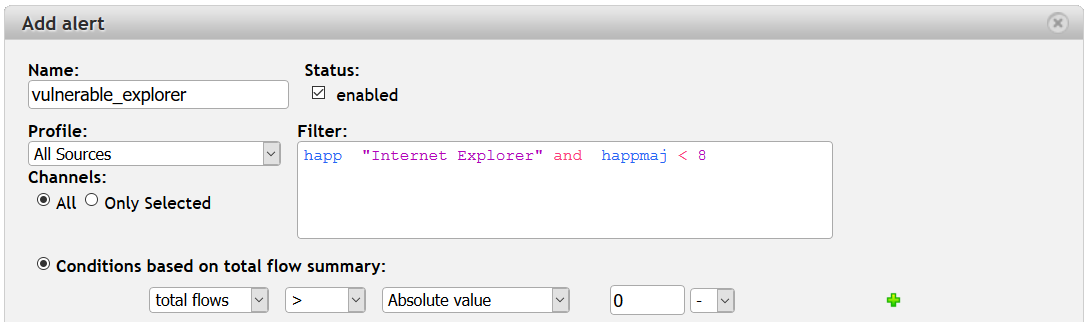
You can also filter a specific HTTP Application (filter happ ) and version (filters happmaj and happmin ) to see if anyone in the network is using old and vulnerable Internet browsers.
Figure 4: Using HTTP protocol visibility to alert on specific Internet browsers and versions.
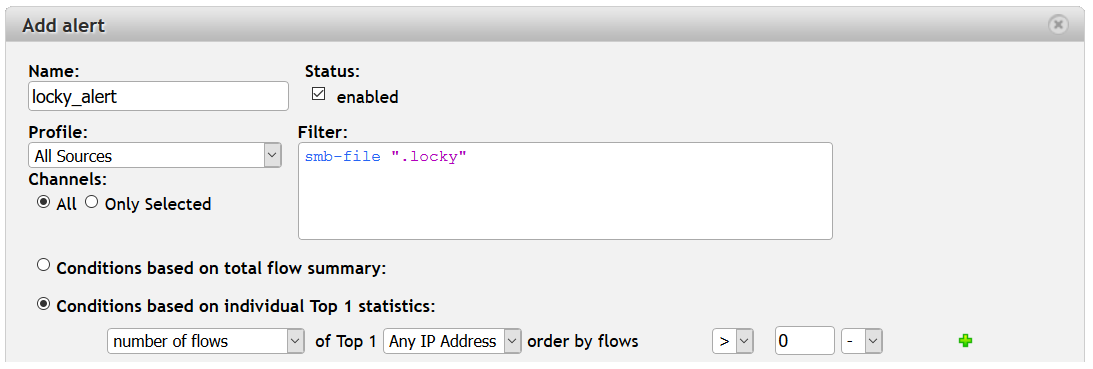
Do you want to detect whether files encrypted by Locky are in your network? Locky is still on the rise. Recently, Locky was spreading over Facebook chat in .svg images. What is the chance that one of your employees will browse Facebook, click on this message and get infected? Well, you actually know who is browsing Facebook using the alert above – let us create another alert to see who gets infected.
It is pretty simple. Create an alert with the filter smb-file “.locky” and apply it on your network or SMB traffic profiles and set the condition on any occurrence (flows > 0). Once this occurs, you will at once know and be able to act.
Figure 5: Using SMB protocol visibility to alert on Locky ransomware.
Another use-case utilize SIP monitoring for detecting calls on premium numbers when your PBX does not block these type of calls. If you are interested in such an alert, check out our earlier blog post. You can also read this blog post with an alert for DHCP NAK messages , so you will know when hosts have problems with obtaining network configuration. And last but not least is the DNS protocol and an example of alerting on NXDomain here.
Conclusion
Alerts in Flowmon Monitoring Center help you to be notified about various events or incidents in your network. Using filters, you can create many interesting and useful alerts to cover various operational use-cases . Do you have any interesting use-cases that use alerts? Share them in the comment section below.
If you are interested in more security related use-cases , check out our Flowmon ADS which automatically detects security incidents in your network.
See you next time.